

For the latest standardized performance and holdings of Sprott Uranium ETFs, please visit the individual website pages: URNM and URNJ. Past performance is no guarantee of future results.
Key Takeaways
- Uranium Fundamentals Are Strong: Rising reactor requirements are meeting a constrained supply base, while long-term uranium prices have reached an 18-year high.
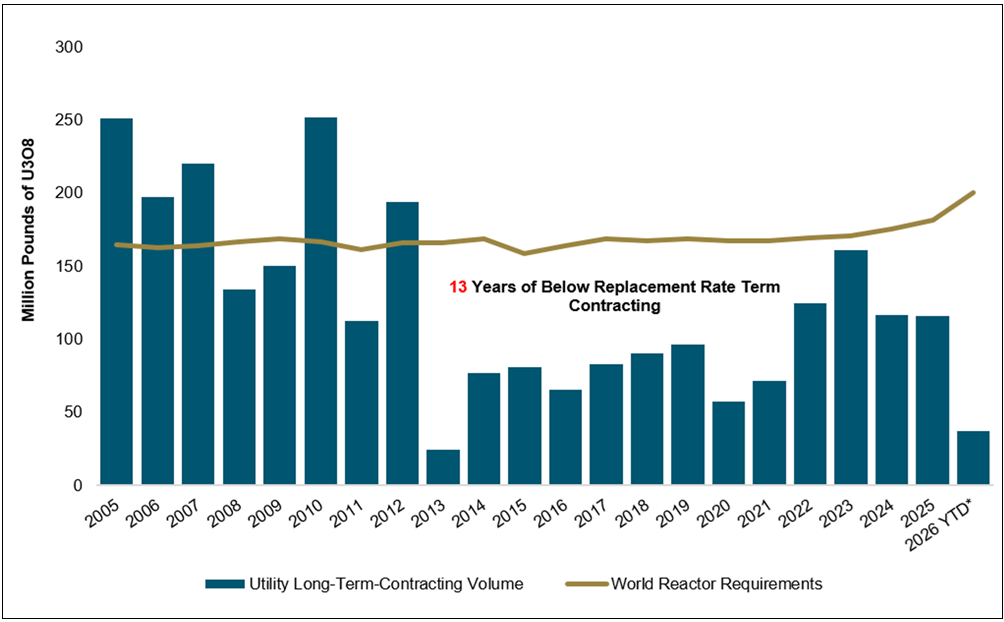
- The Next Contracting Cycle Is Approaching: After 13 years of below-replacement contracting, utilities face growing pressure to secure future uranium supply.
- Contract Coverage Falls Sharply After 2030: U.S. and European utilities face significant uncovered requirements that must be secured years in advance.
- Competition for Supply Is Intensifying: Western utilities must reduce their dependence on Russia while competing with China, Russia and India for limited Kazakh and allied supply.
- Supply Cannot Respond Quickly: Long development timelines, operating disruptions and producer discipline constrain the industry’s ability to increase production rapidly.
Performance as of July 31, 2026
| Metric | 1 MO* | 3 MO* | YTD* | 1 YR | 3 YR | 5 YR |
|
U3O8 Uranium Spot Price1 |
1.61% | 0.20% | 5.96% | 21.25% | 15.41% | 21.72% |
| Uranium Mining Equities (VettaFi Global Uranium Mining Index)2 |
-7.19% | -27.84% | -10.82% | 12.00% | 16.89% | 15.08% |
| Uranium Junior Mining Equities (Nasdaq Sprott Junior Uranium Miners Index TR)3 |
-6.37% | -29.39% | -13.33% | 15.02% | 15.50% | 10.54% |
|
Broad Commodities (BCOM Index)4 |
7.21% | -6.02% | 20.39% | 30.51% | 7.14% | 6.52% |
|
U.S. Equities (S&P 500 TR Index)5 |
-0.06% | 4.19% | 10.14% | 19.56% | 19.31% | 12.85% |
*Performance for periods under one year is not annualized.
Source: Bloomberg as of 7/31/2026. You cannot invest directly in an index. Past performance is no guarantee of future results.
Performance Overview: Uranium Improves as Equities Rebound
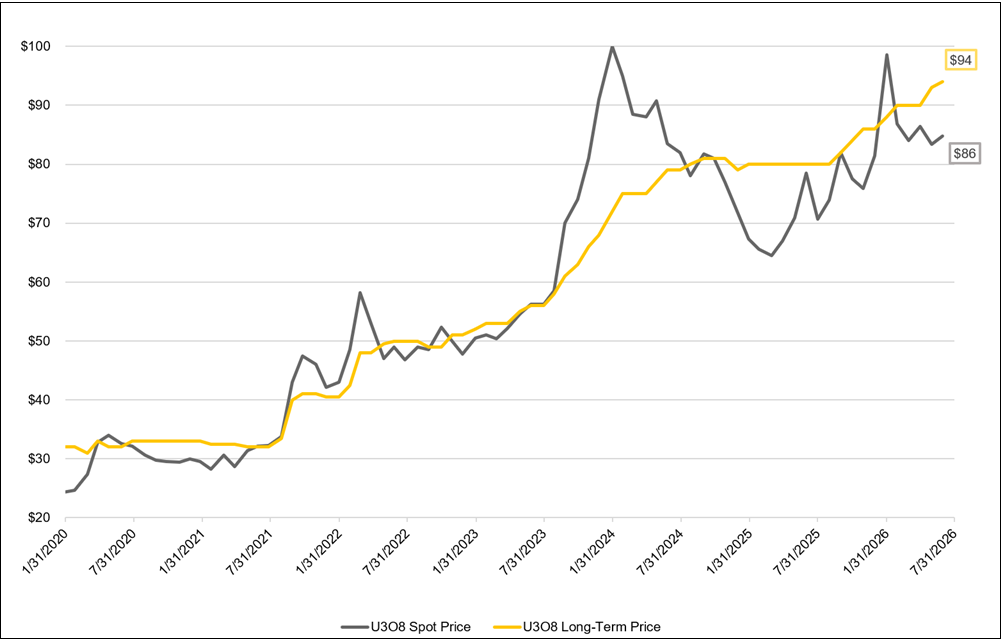
Uranium prices strengthened in July as utilities remained on track for a 14th consecutive year of contracting below reactor requirements, further widening a procurement gap that will eventually need to be filled. The uranium spot price ended July at $86.40/lb, a 1.61% gain, bringing its year-to-date increase to 5.96%. The long-term uranium price remained at $94/lb, its highest level in the current cycle and in 18 years (Figure 1).
Figure 1. Long-Term Uranium Price vs. Spot Price (2020-2026)
Source: Bloomberg and UxC. Data as of 7/31/2026.
Despite a higher uranium spot price, stable long-term pricing and intact fundamentals, uranium mining equities diverged from the underlying commodity in July, with seniors declining 7.19% and juniors off 6.37%. However, miners have rebounded sharply in early August, and at this writing, both groups are near flat for the year.
Long-term uranium prices are rising because future supply is still scarce.
With uranium prices relatively stable, the rebound appears to reflect improving risk sentiment and renewed investor interest rather than a change in fundamentals. Recent market developments support that reassessment. Utility contracting remains far below the volume needed to replace annual reactor consumption, while newly released U.S. and European data confirm that utilities still have substantial future fuel requirements to secure. At the same time, the long-term price is approaching $100/lb, indicating that the market is already assigning greater value to reliable future supply.
Looking at longer-term performance, uranium and uranium miners have meaningfully outpaced equities and broader commodity benchmarks over the past five years (Figure 2).
Figure 2. Physical Uranium and Uranium Stocks Have Outperformed Other Asset Classes Over the Past Five Years (7/31/2021-7/31/2026)
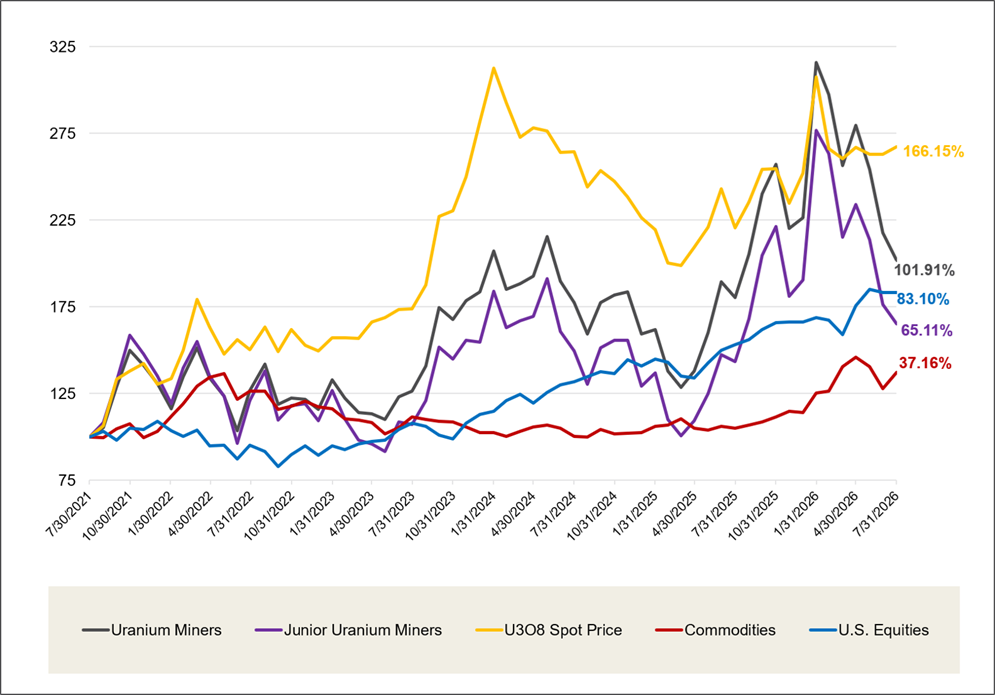
Source: Bloomberg and Sprott Asset Management. Data as of 7/31/2026. Uranium Miners are measured by the VettaFi Global Uranium Mining Index (URNMX index); Junior Uranium Miners are measured by the Nasdaq Sprott Junior Uranium Miners™ Index (NSURNJT™ Index); U.S. Equities are measured by the S&P 500 TR Index; the U3O8 uranium spot price is measured by a proprietary composite of U3O8 spot prices from UxC, S&P Platts, Numerco and TradeTech LLC.; and Commodities are measured by the Bloomberg Commodity Index (BCOM). Definitions of the indices are provided in the footnotes. You cannot invest directly in an index. Past performance is no guarantee of future results.
Sprottlight
E.U. and U.S. Uranium Contract Coverage Declines Rapidly
New U.S. and European uranium market reports released in July brought the next contracting cycle into sharper focus, highlighting significant post-2030 requirements that utilities will need to secure years in advance.
Europe provides a clear example. EU utilities remain well covered across uranium, conversion and enrichment through approximately 2030, but coverage declines rapidly thereafter. Maximum uranium coverage, which assumes that utilities exercise the full volume flexibility available under existing contracts, falls from 100% in 2030 to 81% in 2031, 78% in 2032 and just 36% by 2034 (Figure 3). Conversion coverage tightens further, falling to 20% by 2034.
These figures point to a more immediate procurement challenge than the post-2030 timeline might suggest. Uranium is typically secured through multi-year term contracts, with deliveries often beginning several years after signing. It must then move through conversion, enrichment and fuel fabrication before reaching a reactor. As a result, utilities will need to begin securing supplies for the early 2030s well before those delivery years arrive.
Europe’s Russian Reliance Complicates the Supply Outlook
Its continued reliance on Russia further compounds Europe’s challenges. Despite Europe’s efforts to diversify nuclear fuel supply following Russia’s invasion of Ukraine, Russian deliveries increased across every major fuel-cycle category in 2025. Russian uranium deliveries to EU utilities rose 7%, conversion deliveries increased by 9% and enrichment sales grew by 12%. Russia retained approximately 16% of the EU uranium market, 24% of conversion and 23% of enrichment.
Western utilities are chasing a shrinking pool of available uranium.
European utilities must secure alternative uranium supply and fuel-processing capacity to replace Russian material, increasing competition for production from Western and allied suppliers just as existing contracts begin to roll off.
Kazakhstan will be central to this competition. As the world’s largest uranium producer, accounting for 39% of global production, it is an important supplier to Western markets. However, a significant share of Kazakh production is already committed to China and Russia, and increasingly India, under long-term arrangements, potentially limiting future availability for Western utilities.
The implications are significant for both the U.S. and Europe. Kazakhstan supplied 28% of the uranium delivered to U.S. utilities in 2025 and 20% of the uranium delivered to EU utilities in 2025. As China continues to expand its reactor fleet, additional Kazakh production may be committed under long-term contracts before Western utilities secure their growing uncovered requirements.
Figure 3. EU Coverage Ratio for Natural Uranium (2026-2034)
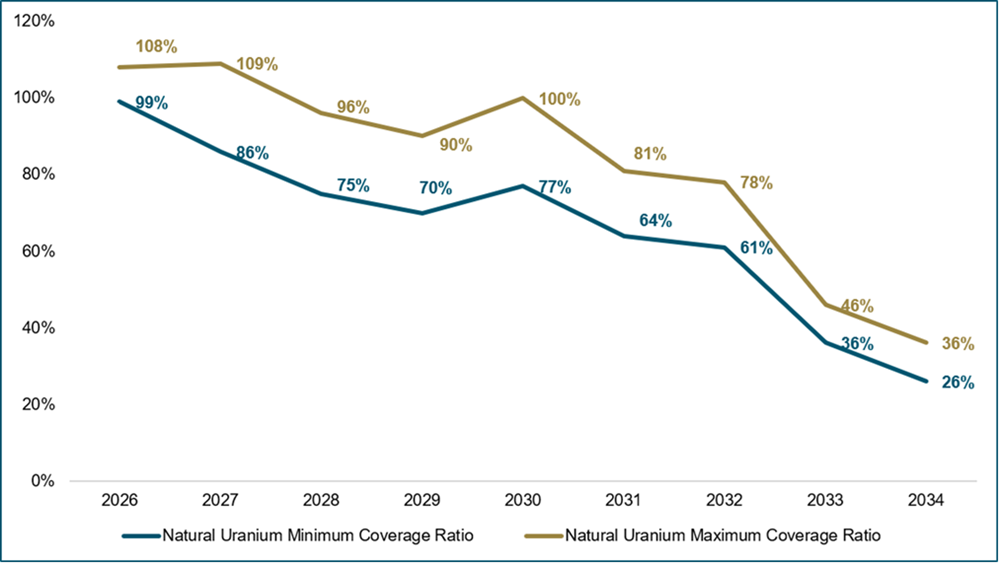
Source: Euratom Supply Agency Annual Report 2025.
U.S. Uranium Contracting Gap Is Widening
The U.S. outlook is even more pressing, especially given that it boasts the world’s largest nuclear fleet. According to the IAEA, the U.S. currently has 94 operating reactors with approximately 97 GW of capacity, well ahead of China (60 reactors) and France (57). The U.S. is also the world’s largest producer of nuclear electricity.
Domestic uranium production remains well short of U.S. utility requirements.
However, assuming that U.S. utilities exercise the full volume flexibility available under existing contracts, maximum contracted coverage falls from approximately 98% of uranium requirements in 2026 to 60% by 2030 and just 9% by 2033 (Figure 4). In other words, contracts cover nearly all anticipated U.S. requirements today, but less than two-thirds by 2030 and very little beyond that point.
This contracting gap is compounded by the U.S. market’s reliance on foreign supply. Domestic uranium production has begun to recover after falling to zero in 2023. Still, it remains small relative to the needs of the U.S.
Uranium of U.S. origin accounted for just 7% of utility deliveries in 2025, compared with approximately 93% from foreign sources, led by Canada at 32%, Kazakhstan at 28% and Australia at 15%.
Growing domestic production should strengthen U.S. energy security over time, while Canada and Australia remain critical allied suppliers. However, domestic supply is not yet sufficient to materially reduce reliance on imports. U.S. utilities will therefore need to secure substantial foreign volumes as domestic and allied production expands and competition for Kazakh uranium intensifies.
Supply Disruptions Highlight Procurement Risk
Recent operating disruptions reinforce the case for securing future supply well in advance. Cameco produced 3.9 million pounds during the June quarter, 15% below the comparable period in 2025, after flooding affected operations at Key Lake and McArthur River and mining at Cigar Lake was temporarily suspended for repairs. Although Cameco maintained its full-year guidance, the disruptions underscore the operational risks inherent in uranium production.6
Similar challenges have emerged elsewhere, including sulfuric acid constraints in Kazakhstan and at the Kayelekera mine in Malawi, as well as weather-related disruptions in Namibia. Collectively, these events highlight the uncertainty surrounding future production and the risk of assuming that every projected pound will arrive as planned.
Utilities seeking to cover requirements for the early 2030s are therefore entering a market in which dependable future supply is increasingly valuable. Delaying procurement could leave buyers competing for a smaller pool of uncommitted Western and allied production, particularly as additional Kazakh uranium is secured under long-term arrangements.
At the same time, incumbent producers continue to emphasize a “value over volume” approach to production, while many new greenfield projects remain years away from first production. Together, these dynamics reinforce the need for utilities to secure long-term supply well before uncovered requirements become immediate.
Figure 4. U.S. Coverage Ratio for Uranium (2026-2033)
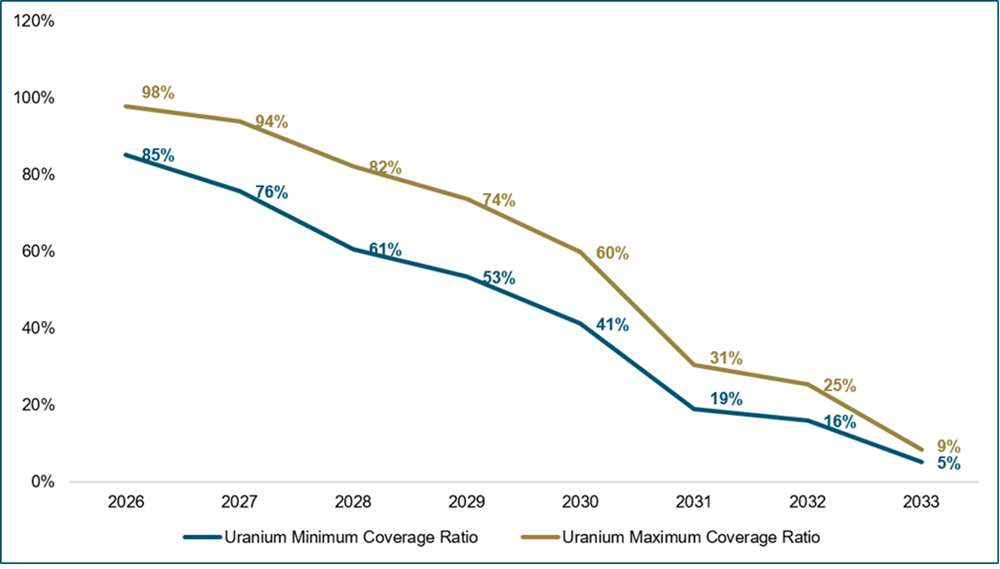
Source: U.S. Energy Information Administration, 2025 Uranium Marketing Annual Report.
Uranium Contracting Remains Anemic
As of August 10, approximately 37 million pounds have been contracted globally in 2026. We acknowledge that this number is understated, as the two purchase agreements announced by India have not yet been reflected in the overall numbers (Figure 5). Nonetheless, the market is on track for a 14th consecutive year of below-replacement contracting.
Years of deferred procurement are increasing competition for future supply.
Utilities have benefited from favorable contract terms in legacy contracts, which provided flex options that allowed them to increase the quantity of uranium deliveries under existing terms. As legacy contracts expire, this supply buffer will disappear. Each year of contracting below reactor consumption leaves more future demand to be covered in later delivery periods.
Utilities can defer purchasing, but they cannot shorten the time required to develop a new uranium supply.
This timing mismatch is central to the bullish uranium outlook. Utilities can return to the market relatively quickly once they decide to purchase. Producers cannot respond on the same timeline. Large uranium mines require substantial capital and can take years to permit, finance, construct and bring into operation.
Producers must decide today how much uranium they are willing to reserve for delivery well into the next decade. They are unlikely to make those commitments unless contract prices and terms compensate them for development costs, inflation, operating risk and the uncertainty involved in delivering future production.
On its July earnings call, Cameco described the uranium market as still in the early stages of a broader contracting cycle and said utilities had not yet purchased enough uranium to replace reactor consumption fully. Nevertheless, long-term uranium has already reached $94/lb.
That price structure is particularly constructive because it has strengthened before contracting has returned to replacement levels. The market is already placing a premium on future uranium while utilities continue to defer a significant portion of their procurement needs.
Demand Growth Adds to Future Supply Requirements
Demand is also moving higher. Reactor life extensions and restarts are preserving uranium requirements that were previously expected to disappear. Uprates will also increase future uranium demand as utilities look to generate more electricity with the current fleet of reactors. Conventional reactors continue advancing toward operation, particularly in China, while India announced in July that it plans to have at least five small modular reactors ready by 20337. These projects will affect uranium consumption at different times, but collectively they broaden the future demand base that available production must serve.
Uranium’s bullish setup does not depend on reactors running short of fuel in 2030. Well before that, utilities will recognize that their future requirements must be secured from a limited and increasingly committed supply base. With contracting still substantially below replacement needs and future uranium already priced at 18-year highs, that recognition could begin influencing the market long before the associated uranium is delivered.
Figure 5. Utility Contracting Cycle Stall (2005-2026)
Source: UxC LLC, 08/10/2026.
Looking Ahead: Catalysts for Uranium’s Next Move
The uranium market is emerging from its typical summer slowdown, but contracting momentum is expected to improve in September as utilities, producers and fuel buyers return from the seasonal lull. The World Nuclear Symposium, taking place in London from September 9 to 11, sits at the start of this period and brings together decision-makers from utilities, uranium mining, conversion, enrichment and fabrication. A pickup in term contracting this fall would be especially meaningful, given the identified decline in U.S. and European contract coverage.
The case for nuclear power is increasingly becoming a case for energy security.
Energy security should remain a key driver of nuclear power. The closure of the Strait of Hormuz exposed the vulnerability of energy systems dependent on global trade routes, disrupting Gulf oil exports and creating broader risks for inflation, economic growth and financial markets. The Dallas Federal Reserve estimated that a complete cessation of Gulf oil exports would remove close to 20% of global oil supply, demonstrating how a disruption at a single maritime chokepoint can reverberate through the global economy8.
Nuclear power offers a differentiated energy-security model. Uranium is highly energy-dense, can be secured and stored for years in advance, and does not require continuous fuel deliveries to keep reactors operating. As governments reassess their exposure to geopolitical disruptions and volatile traded energy markets, nuclear power’s ability to provide reliable, around-the-clock electricity with greater fuel security may become increasingly valuable.
Further reactor restarts, life extensions and new-project announcements could reinforce this shift. These developments increase uranium demand over different time horizons. Restarts and life extensions can preserve or restore requirements from existing reactors relatively quickly, conventional new builds add demand as they approach operation, and small modular and advanced reactors may contribute over a longer period. More announcements appear likely as electricity demand rises and governments seek dependable domestic generation.
Recent progress in advanced reactors provides early evidence that this longer-term source of demand is moving closer to practical deployment. Oklo’s Groves Isotope Test Reactor achieved criticality in July, becoming the fifth advanced reactor authorized through the U.S. Department of Energy’s Reactor Pilot Program to do so during the summer. The test reactor is intended to inform a future commercial design and demonstrate tangible progress from reactor concepts toward operating technology and eventual fuel requirements.
The supply outlook remains constrained by a sustained market deficit. Reactor uranium requirements continue to exceed primary mine production, leaving the market dependent on secondary supplies and inventories to bridge the difference. Higher prices are supporting mine restarts and project development, but new production remains slow to deliver because permitting, financing, construction and ramp-up can require years. Recent operational interruptions and sulfuric acid constraints further show that projected production cannot always be assumed to arrive on schedule.
The combination remains structurally bullish for uranium. A seasonal pickup in contracting could provide the next market catalyst. At the same time, energy-security concerns, electricity demand, reactor restarts, life extensions and progress in advanced nuclear technologies continue to increase future fuel requirements. These demand sources are developing against a uranium supply base that remains concentrated, operationally exposed and difficult to expand quickly.
Figure 6. Uranium Bull Market Continues (1968-2026)
View Larger PDF Version of This Chart
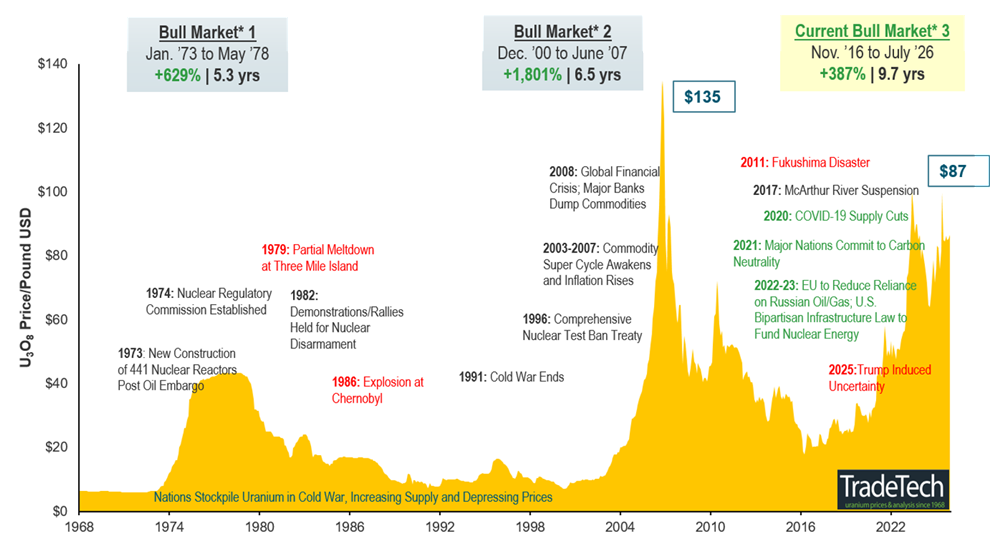
Note: A “bull market” refers to a condition of financial markets where prices are generally rising. A “bear market” refers to a condition of financial markets where prices are generally falling. Source: TradeTech Data as of 07/31/2026. TradeTech is the leading independent provider of uranium prices and nuclear fuel market information. The uranium prices in this chart, dating back to 1968, are sourced exclusively from TradeTech; visit https://www.uranium.info/.
Footnotes
| 1 | The U3O8 uranium spot price is measured by a proprietary composite of U3O8 spot prices from UxC, S&P Platts, Numerco, and TradeTech LLC. |
| 2 | The VettaFi Global Uranium Mining Index (URNMX) was created by North Shore Indices, Inc. (the “Index Provider”). The index was acquired by VettaFi, a differentiated index provider with modern distribution solutions and a subsidiary of TMX Group, and as of 4/30/2026 it was renamed the VettaFi Global Uranium Mining Index. VettafI is responsible for the ongoing maintenance of the Index. The Index is calculated by VettaFi, which is not affiliated with the North Shore Global Uranium Miners Fund (“Existing Fund”), ALPS Advisors, Inc. (the “Sub-Adviser”) or Sprott Asset Management LP (the “Adviser”). |
| 3 | The Nasdaq Sprott Junior Uranium Miners™ Index (NSURNJ™) was co-developed by Nasdaq® (the “Index Provider”) and Sprott Asset Management LP (the “Adviser”). The Index Provider and Adviser co-developed the methodology for determining the securities to be included in the Index and the Index Provider is responsible for the ongoing maintenance of the Index. The Adviser will provide certain services in connection with the Index including contributing inputs in connection with the eligibility and process to determine the initial selection and ongoing composition of the Index constituents. |
| 4 | The Bloomberg Commodity Index (BCOM) is a broadly diversified commodity price index that tracks prices of futures contracts on physical commodities and is designed to minimize concentration in any one commodity or sector. It currently has 23 commodity futures in six sectors. |
| 5 | The S&P 500 or Standard & Poor's 500 Index is a market-capitalization-weighted index of the 500 largest U.S. publicly traded companies. |
| 6 | Source: Cameco.com, 2026 Second Quarter Report. |
| 7 | Source: Reuters, India advances small reactor plans, targets five nuclear units by 2033, 7/22/2026. |
| 8 | Source: Dallasfed.org, What the closure of the Strait of Hormuz means for the global economy, 3/20/2026. |

Important Disclosures
An investor should consider the investment objectives, risks, charges and expenses of each fund carefully before investing. To obtain a fund’s Prospectus, which contains this and other information, contact your financial professional, call 1.888.622.1813 or visit SprottETFs.com. Read the Prospectus carefully before investing.
Exchange Traded Funds (ETFs) are considered to have continuous liquidity because they allow for an individual to trade throughout the day, which may indicate higher transaction costs and result in higher taxes when fund shares are held in a taxable account.
Diversification does not protect against loss. The funds are non-diversified and can invest a greater portion of assets in securities of individual issuers, particularly those in the natural resources and/or precious metals industry, which may experience greater price volatility. Relative to other sectors, natural resources and precious metals investments have higher headline risk and are more sensitive to changes in economic data, political or regulatory events, and underlying commodity price fluctuations. Risks related to extraction, storage and liquidity should also be considered.
Gold and precious metals are referred to with terms of art like "store of value," "safe haven" and "safe asset." These terms should not be construed to guarantee any form of investment safety. While “safe” assets like gold, Treasuries, money market funds and cash generally do not carry a high risk of loss relative to other asset classes, any asset may lose value, which may involve the complete loss of invested principal.
Shares are not individually redeemable. Investors buy and sell shares of the funds on a secondary market. Only “authorized participants” may trade directly with the fund, typically in blocks of 10,000 shares.
The Sprott Rare Earths Ex-China ETF is new and has limited operating history.
Sprott Asset Management USA, Inc. is the Investment Adviser to the Sprott ETFs. ALPS Distributors, Inc. is the Distributor for the Sprott ETFs and is a registered broker-dealer and FINRA Member. ALPS Distributors, Inc. is not affiliated with Sprott Asset Management USA, Inc.