Sprott Gold Miners ETF

As of February 13, 2026
NAV
$84.58
NAV Daily Change
+$4.90
 +6.15%
NAV Since Inception Cumulative Change1
 272.09%
Ticker
SGDM
Market Price2
$84.62
Premium/Discount3
0.05%
Total Net Asset Value
$810.25 Million
Net Total Expense Ratio4
0.50%
Overview
Sprott Gold Miners Exchange Traded Fund (NYSE Arca: SGDM) seeks investment results that correspond (before fees and expenses) generally to the performance of its underlying index, the Solactive Gold Miners Custom Factors Index (Index Ticker: SOLGMCFT). The Index aims to track the performance of larger-sized gold companies whose stocks are listed on Canadian and major U.S. exchanges.
The Index uses a transparent, rules-based methodology that is designed to emphasize larger-sized gold companies with the highest revenue growth, free cash flow yield and the lowest long-term debt to equity. The Index is reconstituted on a quarterly basis to reflect the companies with the highest factor scores.
Key Facts
Ticker
SGDM
Listing Exchange
NYSE Arca
Benchmark Index
SOLGMCFT
Index Rebalance Frequency
Quarterly
ISIN
Show ISIN
ISIN: US85210B1026
Copyright 2026, American Bankers Association. CUISP Database provided by FactSet Research Systems Inc. All rights reserved.
CUSIP
Show CUSIP
CUSIP: 85210B 102
Copyright 2026, American Bankers Association. CUISP Database provided by FactSet Research Systems Inc. All rights reserved.
Inception Date
July 14, 2014
Adviser
Sprott Asset Management USA, Inc.
Sub-Adviser
ALPS Advisors, Inc.
Distributor
ALPS Distributors, Inc.
Fees & Expenses4
| Management Fee | 0.35% |
| Other Expenses | 0.15% |
| Total Annual Fund Operating Expenses | 0.50% |
Fee Waiver/Expense Reimbursement |
0.00% |
| Total Annual Fund Operating Expenses After Fee Waiver/Expense Reimbursements | 0.50% |
ETF Fund Details
February 13, 2026
Total Net Assets
$810,253,521.90
Shares Outstanding
9,580,000
Number of Holdings
40
Median 30 Day Bid Ask Spread
(As of 2/12/2026)
0.48%
Performance
Month-End Performance
Average Annual Total Returns (%) As of 1/31/2026
| Fund | 1 MO* | 3 MO* | YTD* | 1 YR | 3 YR | 5 YR | S.I.1 |
| Sprott Gold Miners ETF (Net Asset Value) |
9.59 | 32.17 | 9.59 | 146.15 | 41.82 | 22.98 | 11.05 |
| Sprott Gold Miners ETF (Market Price)2 |
9.14 | 32.01 | 9.14 | 146.12 | 41.69 | 22.93 | 11.04 |
| Solactive Gold Miners Custom Factors Index TR (Benchmark)5 |
9.65 | 32.40 | 9.65 | 147.88 | 42.90 | 23.93 | 11.98 |
Quarter-End Performance
Average Annual Total Returns (%) As of 12/31/2025
| Fund | 1 MO* | 3 MO* | YTD* | 1 YR | 3 YR | 5 YR | S.I.1 |
| Sprott Gold Miners ETF (Net Asset Value) |
3.37 | 13.77 | 152.87 | 152.87 | 42.84 | 19.41 | 10.26 |
| Sprott Gold Miners ETF (Market Price)2 |
3.61 | 13.90 | 154.03 | 154.03 | 42.86 | 19.43 | 10.28 |
| Solactive Gold Miners Custom Factors Index TR (Benchmark)5 |
3.42 | 13.94 | 154.65 | 154.65 | 43.94 | 20.34 | 11.18 |
Performance data quoted represents past performance. Past performance does not guarantee future results. Current performance may be higher or lower than actual data quoted. Call 888.622.1813 or visit www.sprottetfs.com for current month end performance. The investment return and principal value of an investment will fluctuate so that an investor’s shares, when redeemed, may be worth more or less than their original cost.
* Returns less than one year are not annualized.
1 Inception Date: 7/14/2014.
2 Market Price is based on the midpoint of the bid/ask spread at 4 p.m. ET and does not represent the returns an investor would receive if shares were traded at other times.
3 The Premium/Discount is the amount (stated in dollars or percent) by which the selling or purchase price of an ETF is greater than (premium) or less than (discount) its face amount/value or net asset value (NAV).
4 Sprott Asset Management USA, Inc. (the “Adviser”), the Investment Adviser to the Fund, has contractually agreed to waive the management fee, and/or reimburse expenses so that Total Annual Fund Operating Expenses After Fee Waiver/Expense Reimbursements (not including distribution (12b-1) fees, shareholder service fees, acquired fund fees and expenses, taxes, brokerage commissions and extraordinary expenses) do not exceed a maximum of 0.50% of the share’s average daily net assets through April 30, 2035.
5 From July 22, 2019, forward Index data reflects the Fund’s current underlying Index, the Solactive Gold Miners Custom Factors Index (SOLGMCFT), which was created by Solactive AG ("Index Provider") to provide a means of generally tracking the performance of gold mining companies whose stocks are traded on Canadian and major U.S. exchanges. Index data prior to July 22, 2019, reflects the Fund’s former index, the Sprott Zacks Gold Miners Index (ZAXSGDM). Index data shown for periods that include dates prior to July 22, 2019, reflect a blend of the performance of the SOLGMCFT and ZAXSGDM Indices. An investor cannot invest directly in an Index. SGDM was reorganized from ALPS ETF Trust into Sprott ETF Trust on or about 7/19/19. SGDM is a continuation of the prior Fund and, therefore, the performance information shown includes the prior Fund's performance. One cannot invest directly in an index.
Market Price vs. Net Asset Value Since Inception
User Options: Mouse over the graph to view detailed daily values; click and drag your mouse to choose specific time frames. Click on the "Reset Zoom" button to return to the full timeline view.
Inception date: July 14, 2014.
Historical Premium/Discount: Market Price to Net Asset Value
User Options: Mouse over the graph to view detailed daily values; click and drag your mouse to choose specific time frames. Click on the "Reset Zoom" button to return to the full timeline view.
Inception date: July 14, 2014.
Frequency Distribution: Premium/Discount
Trading Days Each Quarter
Data updated as of February 17, 2026
| CY 2025 | Q1 2026 | Q2 2026 | Q3 2026 | Q4 2026 | |
| Days Traded at Premium | 149 | -- | -- | -- | -- |
| Days Traded at Discount | 88 | -- | -- | -- | -- |
Portfolio Characteristics*
As of 1/31/2026
| Number of Companies | 40 |
| Market Cap (millions) | $784,365.33 |
| Largest Market Cap (millions) | $122,603.40 |
| Smallest Market Cap (millions) | $1,839.73 |
| Weighted Avg. Company Market Cap (millions) | $40,523.38 |
| Market Cap Breakdown | |
| Large (>$10B) | 62.92% |
| Medium ($2 -$10B) | 36.95% |
| Small (<$2B) | 0.12% |
| Industry Weightings | |
| Gold | 88.42% |
| Precious Metals | 11.58% |
* Excludes cash
Company Domicile Breakdown*
As of 1/31/2026
Holdings
As of 2/13/2026
| Security | Market Value | Symbol | SEDOL | Quantity | Weight |
|---|---|---|---|---|---|
| Agnico Eagle Mines Ltd. | $86,470,232.62 | AEM CN | 2009823 | 399,090.00 | 10.67% |
| Newmont Corp. | $65,084,517.00 | NEM | 2636607 | 517,365.00 | 8.03% |
| Wheaton Precious Metals Corp. | $60,961,942.09 | WPM CN | BF13KN5 | 417,863.00 | 7.52% |
| Anglogold Ashanti PLC | $54,072,732.32 | AU | BRXH266 | 492,376.00 | 6.67% |
| Franco-Nevada Corp. | $48,484,950.37 | FNV CN | B29NF31 | 192,018.00 | 5.98% |
| Kinross Gold Corp. | $44,355,811.77 | K CN | B03Z841 | 1,288,798.00 | 5.47% |
| Royal Gold Inc. | $35,911,844.20 | RGLD | 2755706 | 125,522.00 | 4.43% |
| Barrick Mining Corp. | $33,244,251.51 | ABX CN | BNM23Q1 | 693,106.00 | 4.10% |
| OceanaGold Corp. | $27,547,248.04 | OGC CN | BQXQY26 | 711,189.00 | 3.40% |
| Lundin Gold Inc. | $27,150,653.93 | LUG CN | BTKSSY6 | 337,395.00 | 3.35% |
| G Mining Ventures Corp. | $27,006,362.29 | GMIN CN | BSWW128 | 745,714.00 | 3.33% |
| New Gold Inc. | $26,557,640.45 | NGD CN | 2826947 | 2,393,615.00 | 3.28% |
| DPM Metals Inc. | $24,513,678.56 | DPM CN | BPCR7W4 | 642,617.00 | 3.03% |
| Orla Mining Ltd. | $24,343,763.19 | OLA CN | BYZGJ92 | 1,396,485.00 | 3.00% |
| Harmony Gold Mining Co. Ltd. | $24,259,927.15 | HMY | 2411202 | 1,155,785.00 | 2.99% |
| OR Royalties Inc. | $23,454,489.13 | OR CN | BPJJWP1 | 549,106.00 | 2.89% |
| Centerra Gold Inc. | $23,205,427.42 | CG CN | B01NXQ4 | 1,231,099.00 | 2.86% |
| K92 Mining Inc. | $22,946,430.22 | KNT CN | BYZ2CB3 | 1,116,057.00 | 2.83% |
| B2Gold Corp. | $21,812,636.85 | BTO CN | B29VFC4 | 4,041,570.00 | 2.69% |
| Triple Flag Precious Metals Corp. | $20,837,213.31 | TFPM CN | BJ171P4 | 576,069.00 | 2.57% |
| Fortuna Mining Corp. | $19,548,739.24 | FVI CN | BPLQGB4 | 1,767,759.00 | 2.41% |
| Wesdome Gold Mines Ltd. | $18,045,258.88 | WDO CN | B0Y90N5 | 1,035,170.00 | 2.23% |
| Gold Fields Ltd. | $11,511,864.00 | GFI | 2416326 | 210,840.00 | 1.42% |
| Eldorado Gold Corp. | $3,179,433.27 | ELD CN | BHZJ5Y9 | 67,120.00 | 0.39% |
| IAMGOLD Corp. | $2,960,410.44 | IMG CN | 2446646 | 136,573.00 | 0.37% |
| Coeur Mining Inc. | $2,951,413.64 | CDE | 2208136 | 131,642.00 | 0.36% |
| Endeavour Mining PLC | $2,813,888.83 | EDV CN | BN7KJJ5 | 45,110.00 | 0.35% |
| SSR Mining Inc. | $2,807,233.92 | SSRM CN | BF7MPL9 | 99,792.00 | 0.35% |
| Pan American Silver Corp. | $2,730,266.92 | PAAS CN | 2669272 | 47,066.00 | 0.34% |
| Alamos Gold Inc. | $2,618,125.29 | AGI CN | BZ3DNP6 | 57,872.00 | 0.32% |
| Equinox Gold Corp. | $2,364,624.32 | EQX CN | BKLNP13 | 149,571.00 | 0.29% |
| Novagold Resources Inc. | $2,281,038.14 | NG CN | 2135450 | 212,333.00 | 0.28% |
| Torex Gold Resources Inc. | $2,136,489.33 | TXG CN | BD2NKY1 | 47,698.00 | 0.26% |
| Skeena Resources Ltd. | $1,991,517.45 | SKE CN | BMDM761 | 60,163.00 | 0.25% |
| Aris Mining Corp. | $1,966,939.53 | ARIS CN | BQKRCQ2 | 100,740.00 | 0.24% |
| Montage Gold Corp. | $1,940,768.66 | MAU CN | BMYMV13 | 180,412.00 | 0.24% |
| Allied Gold Corp. | $1,940,403.63 | AAUC CN | BS5YX69 | 61,612.00 | 0.24% |
| Seabridge Gold Inc. | $1,762,319.68 | SEA CN | 2246459 | 51,881.00 | 0.22% |
| Perpetua Resources Corp. | $1,752,458.44 | PPTA CN | BNNNK40 | 60,604.00 | 0.22% |
| Southern Cross Gold Consolidated Ltd. | $991,646.25 | SXGC CN | BTFK8C5 | 128,372.00 | 0.12% |
| Cash Equivalent | $-263,070.38 | $-263,070.38 | 0.01% |
40 total, excluding cash and cash equivalents. Subject to change.
Distributions
Ex-Date |
Record Date |
Payable Date |
Short-Term Capital Gains |
Long-Term Capital Gains |
Ordinary Income |
Total Distributions |
| 12/24/2014 | 12/29/2014 | 01/02/2015 | - | - | - | - |
| 12/23/2015 | 12/28/2015 | 12/31/2015 | - | - | $0.05 | $0.05 |
| 12/21/2016 | 12/23/2016 | 12/29/2016 | - | - | $0.19 | $0.19 |
| 12/21/2017 | 12/22/2017 | 12/28/2017 | - | - | - | - |
| 12/20/2018 | 12/21/2018 | 12/27/2018 | - | - | $0.12 | $0.12 |
| 12/19/2019 | 12/20/2019 | 12/27/2019 | - | - | $0.06 | $0.06 |
| 12/16/2020 | 12/17/2020 | 12/23/2020 | - | - | $0.09 | $0.09 |
| 12/15/2021 | 12/16/2021 | 12/22/2021 | - | - | $0.36 | $0.36 |
| 12/15/2022 | 12/16/2022 | 12/22/2022 | - | - | $0.35 | $0.35 |
| 12/14/2023 | 12/15/2023 | 12/21/2023 | - | - | $0.35 | $0.35 |
12/12/2024 |
12/12/2024 |
12/19/2024 |
- |
- |
$0.29 |
$0.29 |
12/18/2025 |
12/18/2025 |
12/22/2025 |
- |
- |
$0.73 |
$0.73 |
Literature
Fact Sheet
Quarterly Investor Presentation
Index Rebalance
Year-End Distributions
Regulatory Documents
- Semi-Annual Financial Statements and Other Important Information, June 30, 2025
- Tailored Shareholder Report, June 30, 2025
- Annual Reports Financial Statements and Other Important Information, December 31, 2024
- Tailored Shareholder Report, December 31, 2024
- Tailored Shareholder Report, June 30, 2024
- Semi-Annual Reports Financial Statements and Other Important Information, June 30, 2024
- Summary Prospectus
- Statutory Prospectus
- Supplemental Prospectus
- Statement of Additional Information
- Annual Report, December 31, 2023
Commentary
The Changing Global Order Is Repricing Gold
REPORT · 2/10/2026
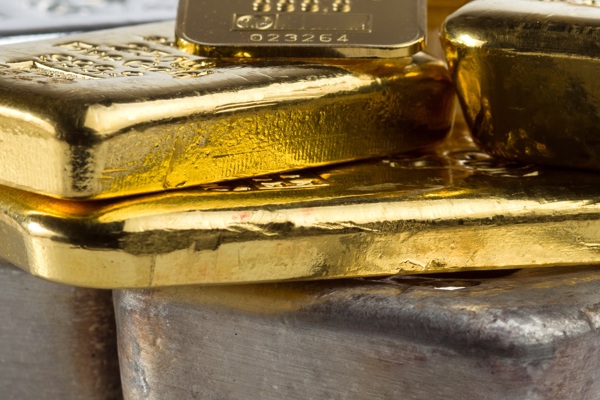
Gold and silver surged to record highs in January before experiencing technically driven sell-offs. Geopolitical fragmentation, capital conflict and eroding confidence in fiat systems is reshaping what investors consider truly safe. In this emerging monetary regime, gold and silver are asserting their roles as neutral, "outside money" with strong long-term drivers.

Top 10 Themes for 2026
What are the 10 most important themes impacting global markets in 2026? We explore issues from deglobalization and fiscal dominance to the surge in gold, silver and critical materials, and provide our view of where opportunities and risks may be emerging.

Gold Holds Gains as Liquidity Stress Emerges
BY PAUL WONG · 12/05/2025
old reached its highest monthly close in November 2025, driven by fiscal dominance, rising global debt and the Fed’s pivot to “QE-lite.” We believe gold’s strategic role as a safe haven asset is strengthening amid mounting liquidity stress and shifting global financial dynamics. Silver closed November at an all-time high.
How to Purchase
Invest Now
Sprott ETFs are liquid, convenient investments that can be purchased like any regular stock through discount and full-service brokers. You can purchase and trade shares of Sprott ETFs directly through your online brokerage firm; these firms may include:
Contact Us
Investment Adviser
Sprott Asset Management USA, Inc.
320 Post Road, Suite 230
Darien, CT 06820
Telephone: 888.622.1813
Distributor and Sub-Adviser
ALPS
1290 Broadway, Suite 1100
Denver, CO 80203
Client Services
Financial Advisors and Investors
Telephone: 888.622.1813
Email: bullion@sprott.com
Standard Mail
Sprott ETFs
P.O. Box 1107
Denver, CO 80201
Overnight Mail
Sprott ETFs
1290 Broadway
Suite 1100
Denver, CO 80203
