

Overview
October’s weakness illustrated the sensitivity of critical minerals equities to macroeconomic conditions, but it did not materially alter the sector’s longer-term thesis. Resilient economic activity continues to support demand for many critical materials, while supply-side constraints remain supportive across select markets. Should macroeconomic headwinds abate, stronger fundamentals across select materials could provide a more constructive backdrop for miner valuations, many of which are now far removed from their underlying fundamentals.
Key Takeaways
-
Uranium: Uranium equities weakened in the macro sell-off, though rising prices and nuclear deployment continued to support long-term fundamentals.
-
Copper: Higher rates and risk-off sentiment pressured miners, but resilient demand, mine risks and tariff uncertainty supported tight supply. Copper miners outperformed the broader critical materials benchmark.
-
Silver: Silver weakened with broader markets, but constrained supply, investment demand and growing industrial use continue to support its long-term outlook.
-
Battery Metals (Lithium & Nickel): Lithium and nickel remained under pressure amid weak sentiment, supply concerns and Indonesia-related headwinds, weighing on prices.
-
Rare Earths: Fundamentals remained supported despite the sell-off. Dependence on Chinese processing and tight ex-China NdPr pricing reinforce the case for diversified supply.
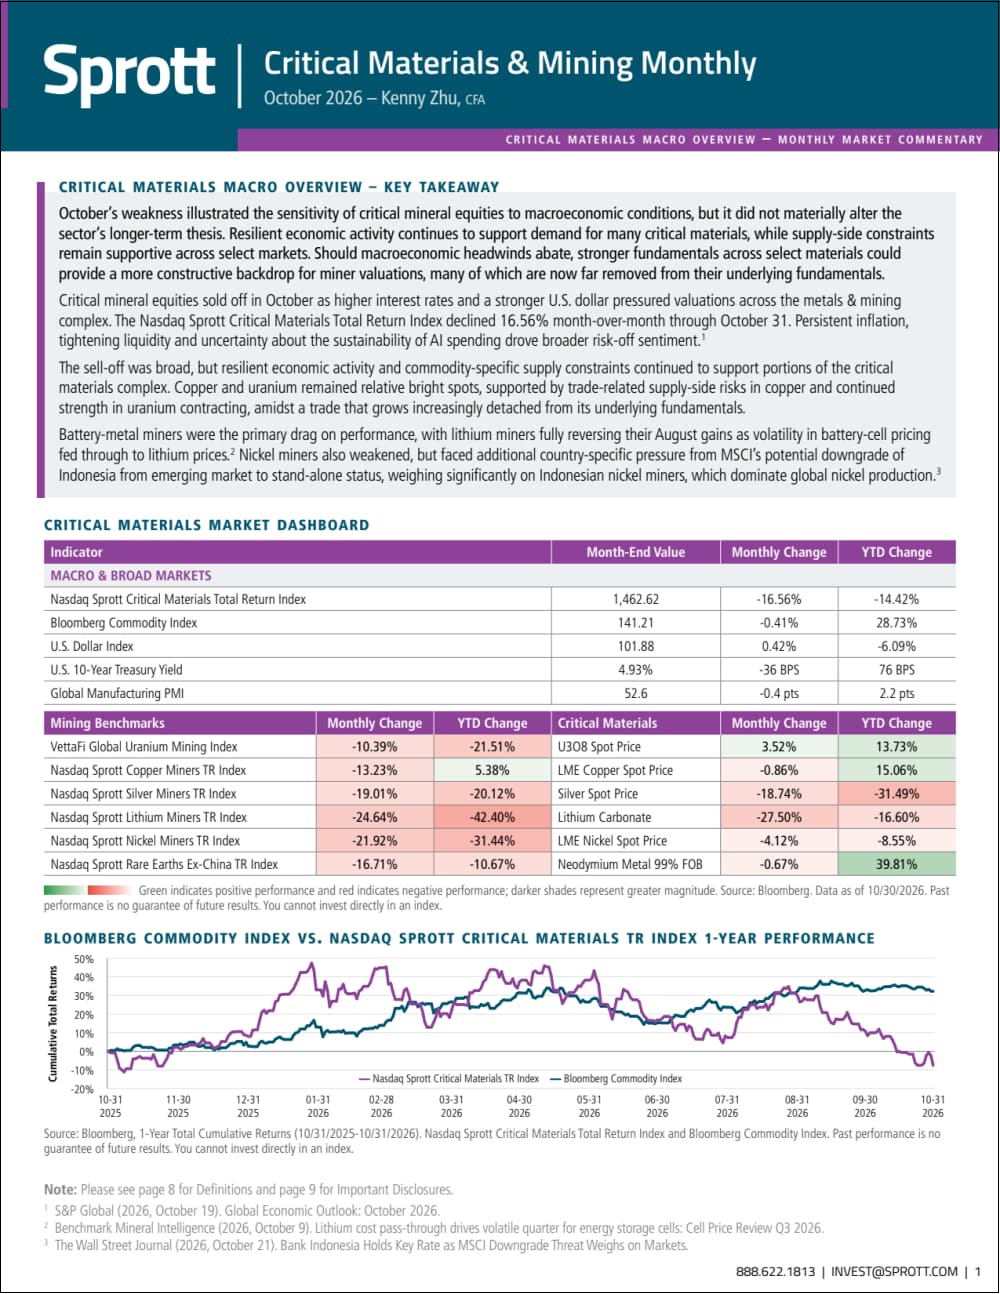
Critical Materials Performance as of October 31, 2026
MINING BENCHMARKS |
Value at Month End | Mo Chg | YTD Chg |
| Nasdaq Sprott Critical Materials™ Total Return Index 1 | 1,462.62 | -16.56% | -14.42% |
| VettaFi Global Uranium Mining Index2 | 3,723.94 | -10.39% | -21.51% |
| Nasdaq Sprott Junior Uranium Miners™ Total Return Index3 | 1,260.89 | -12.71% | -29.57% |
| Nasdaq Sprott Copper Miners™ Total Return Index 4 | 2,049.65 | -13.23% | 5.38% |
| Nasdaq Sprott Junior Copper Miners™ Total Return Index 5 | 2,431.31 | -15.76% | -4.07% |
| Nasdaq Sprott Silver Miners™ Total Return Index6 | 2,304.13 | -19.01% | -20.12% |
| Nasdaq Sprott Lithium Miners™ Total Return Index7 | 469.66 | -24.64% | -42.40% |
| Nasdaq Sprott Nickel Miners™ Total Return Index8 | 561.27 | -21.92% | -31.44% |
| Nasdaq Sprott Rare Earths Ex-China™ Total Return Index9 | 737.16 | -16.71% | -10.67% |
PHYSICAL METALS |
Value at Month End | Mo Chg | YTD Chg |
| U3O8 Uranium Spot Price USD/lb10 | $92.74 | 3.52% | 13.73% |
| U308 Long-Term Price USD/lb11 | $97.00 | 1.04% | 12.79% |
| LME Copper Spot Price USD/mt12 | $14,329 | -0.86% | 15.06% |
| Silver Spot Price USD/oz13 | $49.10 | -18.74% | -31.49% |
| Lithium Carbonate Spot Price USD/mt14 | $14,201 | -27.50% | -16.60% |
| LME Nickel Spot Price USD/mt15 | $15,090 | -4.12% | -8.55% |
| Neodymium Metal 99% FOB USD/mt16 | $149,250 | -0.67% | 39.81% |
MACRO & BROAD MARKETS INDICES |
Value at Month End | Mo Chg | YTD Chg |
| Bloomberg Commodity Index17 | 141.21 | -0.41% | 28.73% |
| U.S. Dollar Index18 | 101.88 | 0.42% | -6.09% |
| U.S. 10-Year Treasury Yield19 | 4.93% | -36 BPS | 76 BPS |
| Global Manufacturing PMI20 | 52.6 | -0.4 PTS | 2.2 PTS |
* BPS stands for basis points. PTS stands for points.
For the latest standardized performance and holdings of the Sprott ETFs, please visit the individual website pages: SETM, URNM, URNJ, COPP, COPJ, REXC, LITP, NIKL, METL and GBUG. Past performance is no guarantee of future results.
Footnotes
| 1 | The Nasdaq Sprott Critical Materials™ Total Return Index (NSETMT) tracks the performance of global public securities in the critical materials and energy transition industries, with gross cash dividends reinvested. |
| 2 | The VettaFi Global Uranium Mining Index (ticker: URNMX; formerly known as the North Shore Global Uranium Mining Index) is an equity benchmark designed to track the performance of global companies involved in the mining, exploration, development, and production of uranium, as well as entities that hold physical uranium, uranium royalties, or related non-mining assets. |
| 3 | The Nasdaq Sprott Junior Uranium Miners™ Total Return Index (NSURNJT) is a total return benchmark index designed to track the performance of mid-, small-, and micro-capitalization companies involved in the uranium mining and related nuclear fuel sectors. |
| 4 | The Nasdaq Sprott Copper Miners™ Total Return Index (NSCOPPT) is a benchmark index designed to track the total return performance of a global selection of companies in the copper industry, including copper producers, developers, explorers, and physical copper holdings. |
| 5 | The Nasdaq Sprott Junior Copper Miners™ Total Return Index (NSCOPJT) is a stock market index designed to track the total return performance of mid-, small-, and micro-capitalization companies operating in the copper mining industry. |
| 6 | The Nasdaq Sprott Silver Miners™ Total Return Index (NSLVRT) is a specialized benchmark index designed to track the total return performance of a selection of securities in the silver industry, including silver producers, non-producers and physical silver. |
| 7 | The Nasdaq Sprott Lithium Miners™ Total Return Index (NSLITPT) is a benchmark index designed to track the performance of global publicly traded companies in the lithium industry. |
| 8 | The Nasdaq Sprott Nickel Miners™ Total Return Index (ticker symbol: NSNIKLT) is a total return benchmark designed to track the performance of global public securities in the nickel industry. |
| 9 | The Nasdaq Sprott Rare Earths Ex-China™ Total Return Index (NSREXCT) is a benchmark index designed to track the total return performance of a selection of global rare earth industry securities excluding companies based in China. |
| 10 | The U3O8 uranium spot price is measured by a proprietary composite of U3O8 spot prices from UxC, S&P Platts, Numerco and TradeTech LLC. |
| 11 | The U3O8 uranium long-term price is sourced from the UxC Historical Ux Month-End Price Data. |
| 12 | The LME copper spot price is represented by LMCADY Comdty. |
| 13 | The silver spot price is represented by XAG BGN Curncy. |
| 14 | The lithium carbonate price is measured by CN Li2CO3 99.5% DEL., Bloomberg ticker L4CNMJGO AMTL Index. |
| 15 | The nickel spot price is measured by the LME NICKEL SPOT ($), Bloomberg ticker LMNIDY Comdty. |
| 16 | Neodymium is represented by China Neodymium Metal 99% FOB, a primary global benchmark price index for high-purity rare earth metal trade. |
| 17 | The Bloomberg Commodity Index (BCOM) is a broadly diversified, investable benchmark that tracks the price movement of exchange-traded futures contracts on physical commodities. |
| 18 | The U.S. Dollar Index (commonly known as the DXY or USDX) is a financial benchmark that measures the value of the United States dollar relative to a basket of foreign currencies representing major U.S. trading partners. |
| 19 | The U.S. 10-Year Treasury Yield is the annualized return or interest rate that the U.S. government pays to investors who buy a 10-year Treasury note and hold it to maturity. |
| 20 | The Global Manufacturing Purchasing Managers' Index (PMI) is a monthly economic indicator that measures the health and trends of the global manufacturing sector. |

Important Disclosures
An investor should consider the investment objectives, risks, charges and expenses of each fund carefully before investing. To obtain a fund’s Prospectus, which contains this and other information, contact your financial professional, call 1.888.622.1813 or visit SprottETFs.com. Read the Prospectus carefully before investing.
Exchange Traded Funds (ETFs) are considered to have continuous liquidity because they allow for an individual to trade throughout the day, which may indicate higher transaction costs and result in higher taxes when fund shares are held in a taxable account.
Diversification does not protect against loss. The funds are non-diversified and can invest a greater portion of assets in securities of individual issuers, particularly those in the natural resources and/or precious metals industry, which may experience greater price volatility. Relative to other sectors, natural resources and precious metals investments have higher headline risk and are more sensitive to changes in economic data, political or regulatory events, and underlying commodity price fluctuations. Risks related to extraction, storage and liquidity should also be considered.
Gold and precious metals are referred to with terms of art like "store of value," "safe haven" and "safe asset." These terms should not be construed to guarantee any form of investment safety. While “safe” assets like gold, Treasuries, money market funds and cash generally do not carry a high risk of loss relative to other asset classes, any asset may lose value, which may involve the complete loss of invested principal.
Shares are not individually redeemable. Investors buy and sell shares of the funds on a secondary market. Only “authorized participants” may trade directly with the fund, typically in blocks of 10,000 shares.
The Sprott Rare Earths Ex-China ETF is new and has limited operating history.
Sprott Asset Management USA, Inc. is the Investment Adviser to the Sprott ETFs. ALPS Distributors, Inc. is the Distributor for the Sprott ETFs and is a registered broker-dealer and FINRA Member. ALPS Distributors, Inc. is not affiliated with Sprott Asset Management USA, Inc.