

For the latest standardized performance and holdings of Sprott Uranium ETFs, please visit the individual website pages: URNM and URNJ. Past performance is no guarantee of future results.
Key Takeaways
- Uranium Momentum Returns: Spot uranium climbed above $100/lb in January 2026, with miners and juniors surging, reflecting renewed investor focus on the upstream supply chain.
- Policy Driving Strategic Demand: U.S. Section 232 measures and long-term nuclear capacity targets strengthen uranium’s strategic status, supporting higher prices and secure supply incentives.
- Supply Constraints Intensify: Kazakhstan’s tightened exploration control and slow new mine development underscore a concentrated, underinvested supply base, heightening the need for higher incentive pricing.
- Contracting Catch-Up Begins: Years of under-contracting leave utilities with coverage gaps; 2026 could see accelerated procurement, boosting term prices and market momentum.
- Durable Medium-Term Demand: Energy security, electrification, baseload reliability and the growth in AI and data centers anchor uranium demand, supporting both physical uranium and mining equities.
Performance as of January 31, 2026
| Metric | 1 MO* | 3 MO* | YTD* | 1 YR | 3 YR | 5 YR |
| U3O8 Uranium Spot Price1 | 24.18% | 23.00% | 24.18% | 42.80% | 25.89% | 27.44% |
| Uranium Mining Equities (Northshore Global Uranium Mining Index)2 |
38.49% | 22.85% | 39.49% | 95.19% | 33.45% | 25.27% |
| Uranium Junior Mining Equities (Nasdaq Sprott Junior Uranium Miners Index TR) 3 |
45.25% | 25.14% | 45.25% | 102.12% | 26.69% | 32.71% |
| Broad Commodities (BCOM Index)4 | 10.04% | 12.49% | 10.04% | 18.00% | 2.58% | 8.54% |
| U.S. Equities (S&P 500 TR Index)5 | 1.45% | 1.76% | 1.45% | 16.35% | 21.09% | 14.98% |
Performance Overview: Momentum Returns with Force
Uranium has entered 2026 with strengthening momentum as the spot price returned to triple digits and miners responded sharply. We believe this reflects an important shift in investor attention from downstream nuclear themes back to the upstream supply chain, as fundamentals have improved and policy has advanced fuel security.
January delivered exceptional performance across the uranium complex, following a year that laid a stronger foundation than headline spot prices suggested. Spot uranium climbed back to $101.26 per pound and rose 24.18% in January, its highest level since February 2024, when prices peaked at $107. The move also signaled that investor sentiment and positioning have returned with force, with buyers stepping in decisively and pushing the uranium market rapidly through prior resistance levels. The move reinforces uranium’s pattern of trading in phases, with periods of consolidation followed by sharp repricing once participation returns.
January delivered exceptional performance across the uranium complex.
The uranium term price also advanced, rising 2.33% to $88 per pound by month-end, reaching its highest level in this cycle and marking its strongest reading since May 2008. A firm and elevated uranium term price is a cornerstone for industry strength because it anchors utility procurement expectations, improves long-duration price visibility and supports uranium miners by strengthening project economics and increasing confidence that higher incentive prices can be sustained.
Importantly, the uranium spot price is now leading the term price again, shifting the market into backwardation (see Figure 1). While the term market remains the primary signal for the contracting cycle, a spot premium can be consistent with tightening near-term conditions and has often coincided with periods of improving momentum in uranium prices as buyers become more willing to transact at higher levels.
Figure 1. U308 Spot Price vs. Long-Term Contract Price (2004-2026)
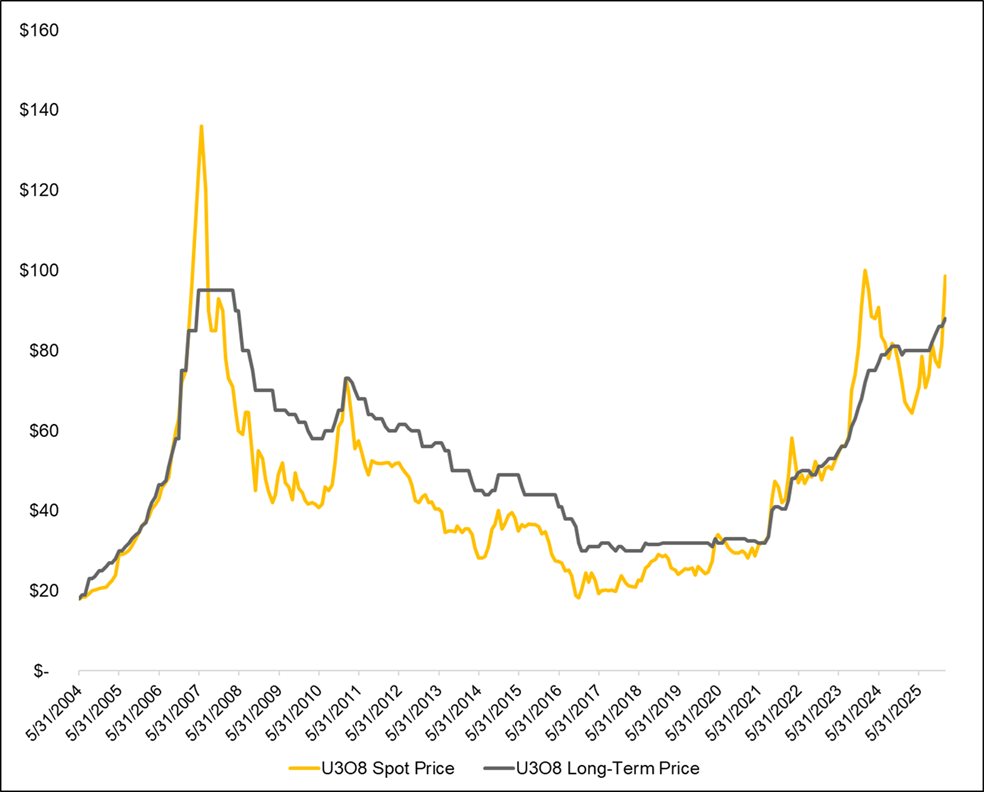
Source: Bloomberg and UxC. Data as of 1/31/2026. U3O8 Spot Price is measured by the UxC Uranium U3O8 Spot Price (UXCPU308 UXCP Index), and U3O8 Long Term Price is measured by the UxC Uranium U3O8 Long-Term Price (UXCPULTM UXCP Index). You cannot invest directly in an index. Included for illustrative purposes only. Past performance is no guarantee of future results.
Uranium mining equities amplified the move. Uranium miners surged 39.49% in January (as measured by the Northshore Global Uranium Mining Index), while junior miners jumped 45.25% (as measured by the Nasdaq Sprott Junior Uranium Miners Index), reflecting a rapid repricing of upstream exposure. This leadership builds on the sector’s resilience in 2025, when spot uranium rose 11.43%, miners gained 41.95%, and juniors advanced 47.49%. January alone has already exceeded or nearly equaled each of those full-year gains, underscoring how quickly the uranium complex can reprice once buying shifts from deferral to action.
Uranium’s path through 2025 was volatile and often frustrating, despite steadily improving fundamentals. January marked a renewed rotation in investor attention toward the upstream segment. Much of last year’s enthusiasm focused on downstream nuclear-related companies, as the nuclear renaissance broadened and policy support intensified. As that narrative matures, investors are increasingly recognizing the transmission mechanism. Stronger nuclear policy and clearer demand visibility ultimately flow through to uranium demand and to the companies positioned to mine the pounds required in the years ahead. The result in early 2026 has been a sharp catch-up move in both physical uranium and uranium mining equities.
Uranium’s renewed momentum also fits within a broader, strengthening market context. Across critical materials, investor interest increasingly reflects a strategic bid for supply chain resilience. Governments and corporations are prioritizing secure access to key inputs across energy, defense and infrastructure, lifting sentiment across select segments of the mining complex. Uranium sits at the intersection of these themes, as both a core energy input and a supply-chain security concern, and is increasingly being treated as a strategic asset.
Looking at longer-term performance, uranium and uranium miners have meaningfully outpaced equities and broader commodity benchmarks over the past five years.
Figure 2. Physical Uranium and Uranium Stocks Have Outperformed Other Asset Classes Over the Past Five Years (01/31/2021-01/31/2026)
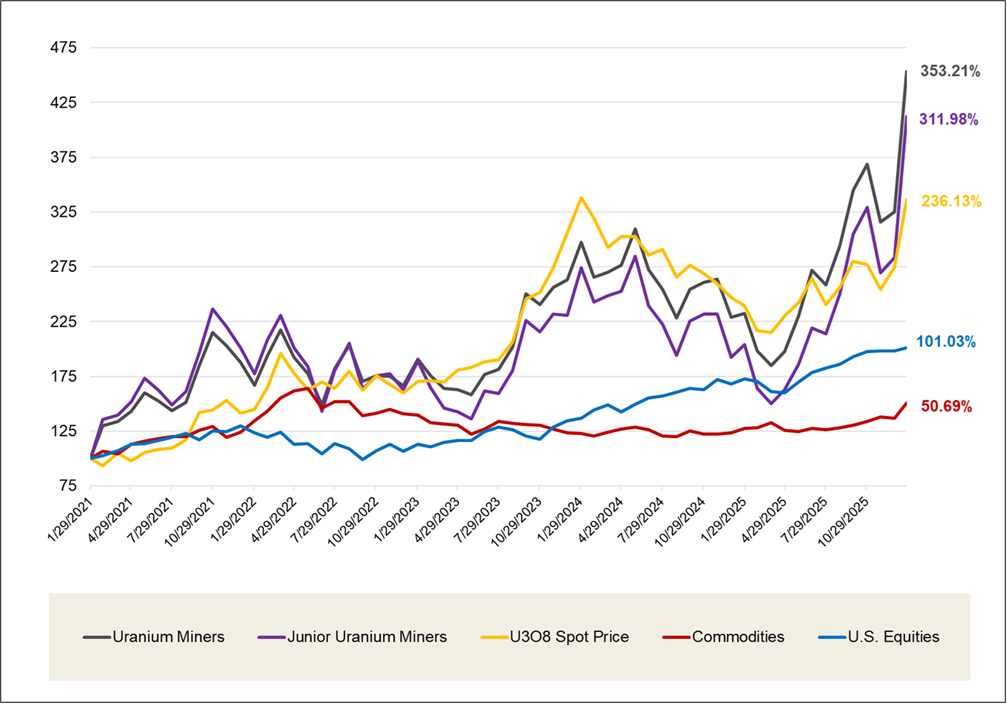
Source: Bloomberg and Sprott Asset Management. Data as of 01/31/2026. Uranium Miners are measured by the Northshore Global Uranium Mining Index (URNMX index); Junior Uranium Miners are measured by the Nasdaq Sprott Junior Uranium Miners™ Index (NSURNJT™ Index); U.S. Equities are measured by the S&P 500 TR Index; the U308 Spot Price is from TradeTech; and Commodities are measured by the Bloomberg Commodity Index (BCOM). Definitions of the indices are provided in the footnotes. You cannot invest directly in an index. Included for illustrative purposes only. Past performance is no guarantee of future results.
Market Drivers
Section 232 Raises the Stakes on Fuel Security
In mid-January, the U.S. issued a Section 232 proclamation on critical minerals, concluding that current import levels threaten to impair the national security of the United States.6 The proclamation explicitly includes uranium in its description of the energy sector's reliance on critical minerals for nuclear fuel, and it frames the vulnerability as overreliance on foreign supply chains, limited, secure and reliable access, and price volatility that can deter investment and weaken domestic capability.
For uranium investors, the most important element is the process this proclamation launches, which directs the U.S. to pursue negotiations with trading partners to adjust imports. It also flags the types of remedies under consideration, including price floors for trade in critical minerals and other trade-restricting measures. The Trump Administration is to receive an update within 180 days, and Section 232 preserves the option for further action if an agreement is not reached.
Section 232 elevates uranium to a strategic asset, creating pricing optionality that could reset long-term incentives for U.S. supply.
Why it matters is the embedded pricing optionality. If negotiations ultimately result in measures that raise the effective price of securing uranium supply in the U.S., uranium could be pulled into a higher-incentive price framework. A higher price would improve project economics and strengthen the long-term price visibility that underpins mine restarts and new development. That matters most for uranium miners, where sustained term-price strength is the key ingredient for durable cash flows, financing and a credible supply response.
This policy signal is being reinforced by tangible support across the nuclear fuel cycle and by explicit U.S. targets that extend demand visibility well beyond the near term. In early January, the U.S. Department of Energy announced $2.7 billion in funding to strengthen domestic uranium enrichment services over the next 10 years, an important step in rebuilding fuel-cycle capacity as energy security priorities intensify.7
More broadly, these actions sit within a clear ambition to quadruple U.S. nuclear capacity by 2050, including another target to have 10 new large reactors under construction by 2030. If the U.S. were to quadruple nuclear capacity, it would require an extraordinary amount of incremental uranium supply, on the order of roughly doubling today’s global uranium production for the U.S. alone (see Figure 3). Taken together, the combination of long-duration capacity targets and near-term fuel-cycle support strengthens the policy tailwind for uranium and uranium miners by improving long-term demand visibility and reinforcing the need for higher incentive pricing to secure a reliable future supply.
Figure 3. U.S. Policy Energizing Uranium
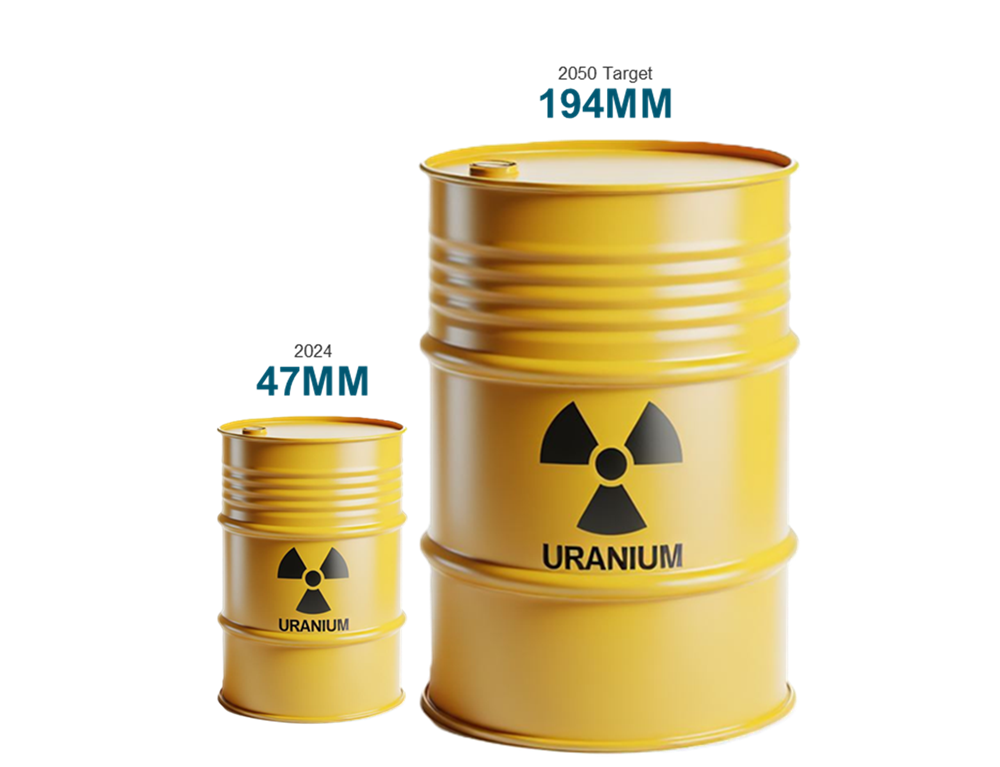
Source: Reflects the uranium required for nuclear generating capacities for the U.S.
Uranium Contracting Catch-Up Begins
The uranium market has long been waiting for a return to sustained contracting. Utilities procure fuel years in advance, and term contracts set coverage for the early 2030s and beyond. While the theoretical replacement rate is roughly 150 million pounds per year, 2025 marked the 13th consecutive year in which contracting fell short of replacement needs (see Figure 4). Deferred procurement does not vanish, it accumulates, increasing the likelihood that utilities will be forced back into the market later with larger volumes to secure, fewer choices and higher prices. That timing pressure is particularly acute in 2026, as contracting decisions made today will shape supply coverage for years ahead, when currently uncovered requirements must be addressed.
The second half of 2025 began to show early signs of that catch-up dynamic. Contracting volumes were muted through the first nine months of the year as utilities navigated uncertainty, but activity improved materially late in the year. Q4 2025 saw roughly 72 million pounds of contracting, over half the total for 2025, which was near 116 million pounds. Even at that level, activity remained below replacement, but its direction was important, suggesting a market moving from deferral to re-engagement, which sets a stronger backdrop for 2026. That late‑year re‑engagement helped pull term pricing higher, reinforcing the incentive framework the uranium industry needs to finance new supply.
Figure 4. Uranium Contracting a Coiled Spring?
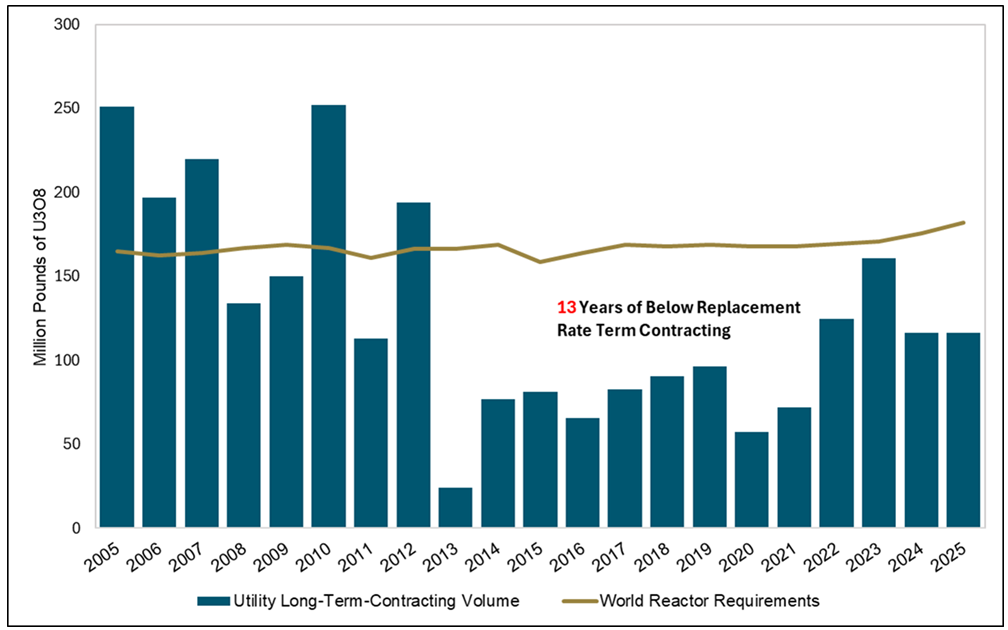
Source: UxC, LLC. Data as of 01/26/2026.
Kazakhstan Tightens Control
Kazakhstan delivered a meaningful supply-side signal on December 29, 2025, by strengthening Kazatomprom’s (the world’s largest producer and seller of uranium) control over future uranium exploration and development. Kazatomprom now has priority rights to obtain exploration licenses in prospective areas and the ability to reserve blocks containing uranium mineralization and or deposits. If uranium is discovered by other subsoil users, extensions become contingent on relinquishing the relevant blocks to the State, and discovery does not confer priority production rights to the discoverer.8 Further, the amendments also raise the bar at key decision points: extensions or incremental production increases may require Kazatomprom to hold at least 90% ownership, potentially compressing partner’s to 10%.
Kazakhstan’s tightened control over uranium exploration reinforces supply risk, signaling higher incentives will be required to unlock future production.
The market relevance became clearer when Laramide Resources Ltd. elected to abandon its large greenfield exploration effort in the Chu-Sarysu Basin shortly after Kazatomprom’s changes were enacted. Management framed the development as effectively pre-emptive national control over future discoveries, arguing that it reduces the risk-reward for new entrants before value is even created.9 They also pointed to a broader industry read-through: greenfield uranium exploration is underinvested and concentrated in too few places, which raises the hurdle for reserve replacement and can require higher prices to incentivize new supply over time.
Stepping back, the supply chain implications are amplified by the uranium market’s existing concentration and tightness. Kazakhstan, Canada and Namibia account for almost three-quarters of global mine production, with Kazakhstan alone contributing 38% of the world supply in 2024.10 Looking ahead, the supply deficit is projected to grow significantly as demand expands and the pipeline of new production struggles to keep pace, leaving the market increasingly dependent on higher incentive pricing to catalyze the next wave of supply (see Figure 5).
Furthermore, Kazatomprom has reiterated its market‑centric approach and stated that it does not view the current uranium pricing, supply‑demand balance or the existing uncovered demand as sufficient to incentivize a return to its 100% levels. Ultimately, the world’s largest, low‑cost producer prioritizes value over volume, and therefore, the supply response will become harder to accelerate.
Figure 5. Uranium Supply and Demand Imbalance May Likely Grow
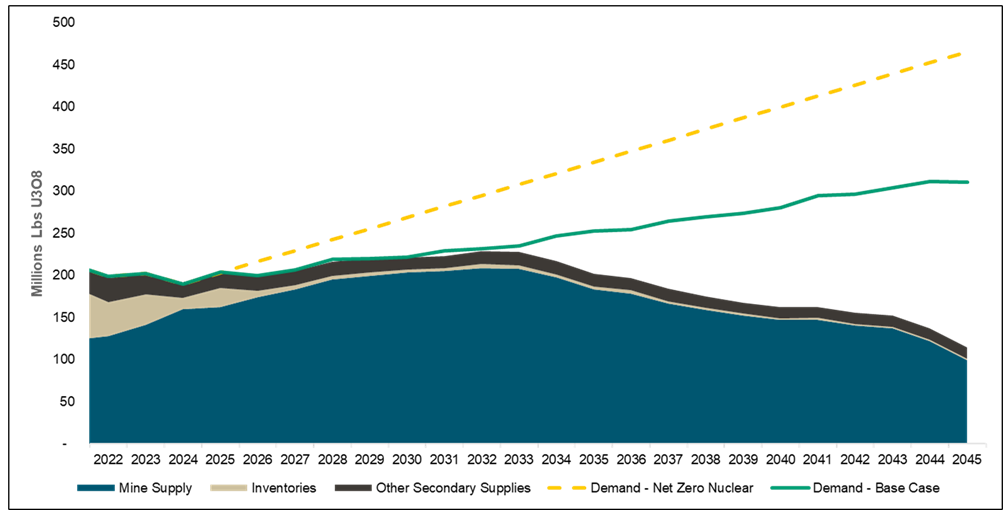
Source: UxC LLC. and Cameco Corp. Data as of 12/31/2025.
Looking Ahead: Catalysts to Watch in 2026
The first month of 2026 provided a clear signal that uranium is entering the year with stronger momentum and a more supportive backdrop than the market experienced in 2025. We believe there are strong catalysts that can reinforce or accelerate the structural drivers already in place. January’s performance suggests the market is beginning to price a tighter setup in which policy clarity, contracting normalization and supply discipline are increasingly aligned.
Uranium markets enter 2026 with renewed momentum, policy support and supply tightness.
Policy remains a central catalyst. The Section 232 framework introduced in January creates a pathway for further actions tied to critical minerals and fuel security. The market does not require a single dramatic headline to stay constructive. Incremental steps that reinforce uranium’s strategic status and increase confidence in the secure buildout of the supply chain can be enough to support a firm market, particularly if utilities respond by extending coverage further out on the curve. Will we see the U.S. government acquire equity stakes in uranium miners in exchange for offtake agreements with price floors? We are seeing these types of transactions in other critical materials, so why not uranium?
Contracting is likely to be the most important confirming signal to watch. Years of under-contracting have left utilities with a cumulative coverage problem that becomes more visible as procurement extends into the 2030s and beyond. Uranium term pricing has already moved higher despite modest levels of contracting, and January’s spot price strength reinforces the market’s responsiveness when buyers return. If contracting volumes improve and utilities accept higher incentive levels, the term market can tighten, supporting both higher realized prices and continued equity strength, particularly for companies with credible projects in stable jurisdictions.
On the supply side, several near-term milestones will shape the market’s perception of the pipeline. Canada’s permitting calendar remains an important watch point, and progress on key projects can improve the visibility of future high-quality supply even though production remains years away. Producer ramp-ups and restarts across the industry can influence near-term availability at the margin, but they will not fully resolve the longer-cycle supply challenge created by rising demand and the slow pace of new mine development.
Uranium demand is becoming increasingly visible, driven by energy security, electrification, and the need for reliable baseload power amid rising electricity demand. While there can be lags between policy announcements and actual fuel procurement, the broader trajectory is clear: nuclear power is being treated as a strategic pillar of energy systems, providing a more durable foundation for uranium demand over the medium term. Additionally, growth in AI and data centers may further support nuclear adoption, as highlighted by Meta’s “landmark” nuclear agreements announced for 2026.11
Taken together, uranium enters 2026 with an increasingly constructive setup. January delivered an early reminder of uranium’s non-linear behavior when fundamentals tighten and sentiment turns. With uranium prices rising, policy momentum building and supply constraints still intact, physical uranium and uranium equities appear well positioned for continued strength as 2026 unfolds. Over the long term, increased demand in the face of an uncertain uranium supply may likely continue supporting a sustained bull market (see Figure 6).
Figure 6. Uranium Bull Market Continues (1968-2026)
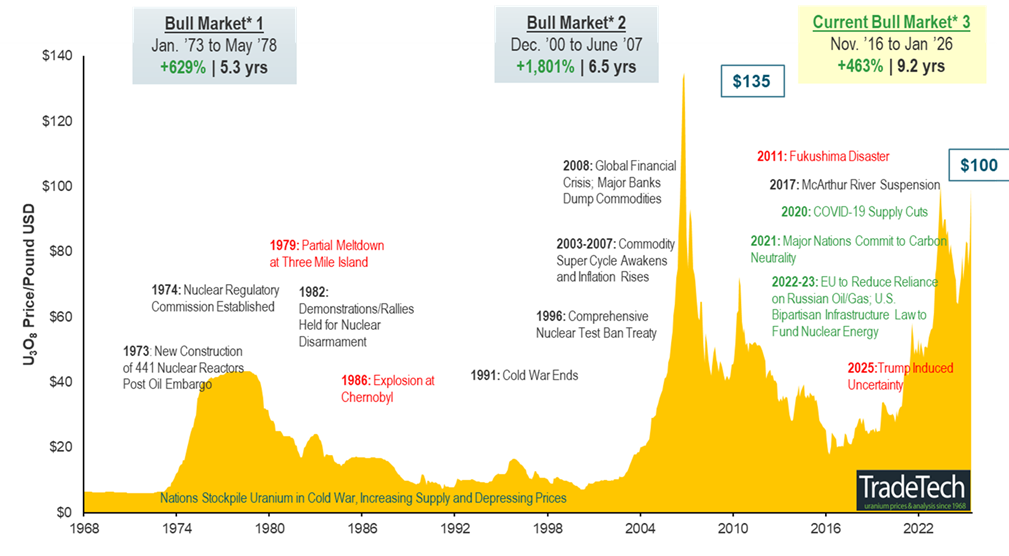
Note: A “bull market” refers to a condition of financial markets where prices are generally rising. A “bear market” refers to a condition of financial markets where prices are generally falling.
Source: TradeTech Data as of 01/31/2026. TradeTech is the leading independent provider of uranium prices and nuclear fuel market information. The uranium prices in this chart dating back to 1968 is sourced exclusively from TradeTech; visit https://www.uranium.info/
Footnotes
| 1 | The U3O8 uranium spot price is measured by a proprietary composite of U3O8 spot prices from UxC, S&P Platts and Numerco. For periods before July 2021 data is from TradeTech LLC. |
| 2 | The North Shore Global Uranium Mining Index (URNMX) was created by North Shore Indices, Inc. (the “Index Provider”). The Index Provider developed the methodology for determining the securities to be included in the Index and is responsible for the ongoing maintenance of the Index. |
| 3 | Nasdaq Sprott Junior Copper Miners™ Index (NSCOPJ™) is designed to track the performance of mid-, small- and micro-cap companies in copper-mining related businesses; the Index was co-developed by Nasdaq® and Sprott Asset Management LP. |
| 4 | The Bloomberg Commodity Index (BCOM) is a broadly diversified commodity price index that tracks prices of futures contracts on physical commodities and is designed to minimize concentration in any one commodity or sector. It currently has 23 commodity futures in six sectors. |
| 5 | The S&P 500 or Standard & Poor's 500 Index is a market-capitalization-weighted index of the 500 largest U.S. publicly traded companies. |
| 6 | Source: Presidential Actions, Adjusting Imports of Processed Critical Minerals and their Derivative Products into the United States, 1/14/2026. |
| 7 | U.S. Department of Energy Awards $2.7 Billion to Restore American Uranium Enrichment, 1/5/2026. |
| 8 | Kazatomprom Announces Amendments to the Subsoil Use Code, 12/29/2025. |
| 9 | Laramide to Abandon Kazakhstan Greenfield Uranium Effort Due to Newly Enacted Government Policy Changes, 1/20/2026. |
| 10 | Source: UxC, LLC. Data as of 12/31/2024. |
| 11 | Source: World Nuclear News, Meta announces 'landmark' agreements for new nuclear, 1/9/2026. |
Important Disclosures
An investor should consider the investment objectives, risks, charges and expenses of each fund carefully before investing. To obtain a fund’s Prospectus, which contains this and other information, contact your financial professional, call 1.888.622.1813 or visit SprottETFs.com. Read the Prospectus carefully before investing.
Exchange Traded Funds (ETFs) are considered to have continuous liquidity because they allow for an individual to trade throughout the day, which may indicate higher transaction costs and result in higher taxes when fund shares are held in a taxable account.
The funds are non-diversified and can invest a greater portion of assets in securities of individual issuers, particularly those in the natural resources and/or precious metals industry, which may experience greater price volatility. Relative to other sectors, natural resources and precious metals investments have higher headline risk and are more sensitive to changes in economic data, political or regulatory events, and underlying commodity price fluctuations. Risks related to extraction, storage and liquidity should also be considered.
Shares are not individually redeemable. Investors buy and sell shares of the funds on a secondary market. Only “authorized participants” may trade directly with the fund, typically in blocks of 10,000 shares.
The Sprott Active Metals & Miners ETF, Sprott Active Gold & Silver Miners ETF and the Sprott Silver Miners & Physical Silver ETF are new and have limited operating history.
Sprott Asset Management USA, Inc. is the Investment Adviser to the Sprott ETFs. ALPS Distributors, Inc. is the Distributor for the Sprott ETFs and is a registered broker-dealer and FINRA Member. ALPS Distributors, Inc. is not affiliated with Sprott Asset Management USA, Inc.