- For the latest standardized performance of the Sprott ETFs, please visit the individual website pages: SGDM, SGDJ, SLVR, SETM, LITP, URNM, URNJ, COPP, COPJ and NIKL. Past performance is no guarantee of future results.
View Critical Materials 2024 Performance Table
Global Macroeconomic Changes
What forces will shape the markets in energy transition materials and other metals in 2025 and beyond? We identify 10 critical macro and market themes investors should watch in the coming year.
#1. The Proliferation of Deglobalization
#2. Energy Security Meets Populism
#3. Critical Materials Lead the Commodity Cycle
#4. Energy Transition Absorbs Policy Rollbacks
#5. More Market Volatility Ahead
#6. Fourth Industrial Revolution’s Endless Energy Demands
Critical Materials
#7. Uranium Fundamentals Keep Getting Stronger
#8. Copper’s Demand-Supply Imbalance Widens
Precious Metals
#9. Central Banks Want Even More Gold
#10. Silver Is Positioned for New Gains
Global Macroeconomic Changes
#1. The Proliferation of Deglobalization
Deglobalization is likely to intensify in 2025. Several converging forces are driving the shift to reduce global economic interdependence, creating a challenging environment for global economic growth and stability. The COVID-19 pandemic exposed vulnerabilities in global supply chains and fueled protectionism and nationalism. The Russia-Ukraine war exposed Europe's energy dependence and led to trade and investment sanctions. Continuing U.S.-China trade tensions, initiated in 2018, will likely intensify under a new Trump administration. These tensions could escalate into broader trade conflicts affecting allies and adversaries alike—for example, EU versus China or EU versus U.S. Beyond tariffs, export restrictions and decoupling efforts are expected to accelerate in strategic sectors like AI, advanced technology, finance and defense.
Deglobalization intensifies in 2025 as protectionism, trade tensions and instability rise.
The global political landscape is further reinforcing these trends. The year 2024 saw elections in over 60 countries, representing more than half the world's population. In many developed nations, anti-incumbent sentiment surged alongside the rise of populist/nationalist movements and signs of democratic erosion. This has created further political and economic uncertainty.
Aggressive U.S. protectionism, primarily through tariffs, is poised to become a key driver of deglobalization in 2025. The U.S. has floated proposals for substantial levies on goods from major trading partners like China, Mexico and Canada, raising fears of a full-blown global trade war, which carries significant risks, including a reduction in global GDP growth. Increased tariffs would likely fuel inflation, dampen consumer spending and hinder economic activity. Policy uncertainty could deter global business investment as companies hesitate to commit to long-term projects amidst unclear trade relationships.
Several factors suggest a trend toward regionalization. Countries may prioritize closer ties with neighbors to mitigate global trade risks by prioritizing new regional agreements and localizing supply chains. Political instability, inconsistent legislation and rising populism could change the path of the energy transition. Although the energy transition seems set to continue, new trends will likely emerge, such as the acceleration of electrification. Amid rising protectionist policies, geopolitical tensions and domestic instability favoring regionalization, the year ahead could be pivotal for deglobalization.
#2. Energy Security Meets Populism
Populist and nationalist ideologies are expected to increasingly shape national security policies in 2025. These ideologies emphasize sovereignty, self-reliance and domestic interests, viewing energy independence as crucial to national security. Such priorities are likely to drive policies favoring domestic energy production and reduced reliance on global energy markets, especially energy from geopolitical rivals. This trend is expected to deepen in 2025.
In 2025, the pursuit of energy security may include greater efforts to diversify energy supplies, sustained investment in domestic energy infrastructure, stockpiling of reserves, and more tariffs, sanctions and subsidies. Policies like "America First" and Europe's attempts to escape Russian gas dependence, a key focus since the 2022 invasion of Ukraine, will continue to shape energy strategies. However, the emphasis on self-reliance could intensify international rivalries over critical resources. Examples are the ongoing disputes in the South China Sea, the Russia-Ukraine conflict and persistent U.S.-China tensions. The theme of resource nationalism is expected to remain a significant driver of energy policy.
Energy security and populism will shape 2025 policies, pushing for self-reliance and reduced foreign dependence.
Renewables offer a pathway to reduce reliance on foreign fossil fuels, enhance energy independence and buffer energy prices from global volatility. However, they face resistance from segments of society influenced by populist narratives, which argue that renewables threaten traditional fossil fuel jobs and create new dependencies on foreign critical minerals. Despite this resistance, renewables can also be framed to align with populist and nationalist agendas—as tools that promote national security, economic growth, and job creation through localized manufacturing and resource extraction, all to the benefit of national sovereignty and economic self-sufficiency. This type of strategic recasting could be a pivotal development in 2025. It may begin when portions of infrastructure spending under the U.S. Inflation Reduction Act (IRA), beneficial to certain states, are defended from cuts.
#3. Critical Materials Lead the Commodity Cycle
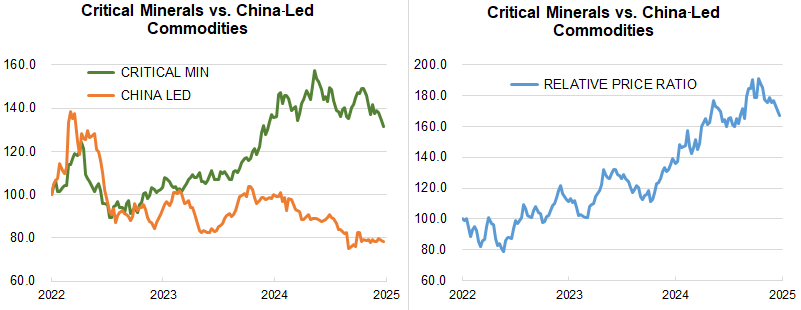
In 2025, there is likely to be a further decoupling between two groups of commodities—the traditional industrial commodities, strongly influenced by China's economic activity (“China-led” commodities), and those tied to the energy transition, electrification and digitalization of the U.S. economy (“critical materials” commodities). This decoupling has been shaped by significant global events in the 2022-2024 period, like the Shanghai COVID outbreak and the Russia-Ukraine war. These events exacerbated market volatility, highlighted vulnerabilities in global supply chains and catalyzed the shift toward new energy systems. As a result, prices of critical materials commodities have outpaced those of China-led commodities (see Figure 1).
Figure 1. The New Commodity Leaders
Prices of commodities tied to critical materials in the energy transition are outperforming those tied to China’s economic activity. The critical materials basket in the chart consists of equal weights of uranium, copper and silver. In contrast, the China-led basket represents equally weighted iron ore, metallurgical coal and Brent oil.
Source: Bloomberg. January 7, 2022 = 100.
Continued investment in renewables remains key. Renewable energy subsidies may evolve, but the fundamental drivers of the energy transition are promoting investment. These drivers include technological advancements, the declining cost of renewable energy technologies and persistent concerns about climate change. Sustained investment is likely to keep driving demand for the critical materials used in renewable energy infrastructure.
Commodities tied to the energy transition will likely continue to outperform those linked to China's economic growth, driven by electrification, digitalization and a shift towards sustainable energy sources.
China's economic trajectory also plays a significant role. China remains a major economic player, but its growth is challenged. The country’s economic model is shifting its focus toward balancing exports, domestic consumption and technological self-reliance. This shift could reduce demand for traditional commodities like iron ore and metallurgical coal, which is likely contributing to the relative underperformance of the China-led commodities basket.
For 2025, the trends seen in Figure 1 are expected to persist as underlying drivers such as electrification, digitalization and energy transition combine with technological innovation, cost competitiveness and climate concerns. This is likely to keep upward pressure on the prices of critical minerals commodities and maintain their performance advantage over the China-led commodities.
#4. Energy Transition Absorbs Policy Rollbacks
Impending Republican control of the U.S. executive and legislative branches has introduced uncertainties for renewable energy policy and the energy transition in 2025. The new administration has said it intends to roll back key policies affecting electric vehicles (EVs), emissions and support for renewables. Potential scenarios include ending the $7,500 EV tax credit, scaling back support for charging infrastructure, and potentially redirecting funds to defense and securing non-Chinese sources of batteries and critical minerals. Tariffs on battery materials, with exemptions for allies to reduce reliance on China, are also under consideration.
The new administration may also want to roll back emissions and fuel economy standards to 2019 levels and block states from setting stricter standards. It may also waive environmental reviews for EV infrastructure and expand export restrictions on EV battery technology. However, some conservative lawmakers, along with certain states and business players, may resist the full dismantling of clean energy support. State-level climate regulations could increase if federal rollbacks occur. While a U.S. withdrawal from international climate agreements is possible, economic realities and political resistance are expected to constrain such actions in 2025.
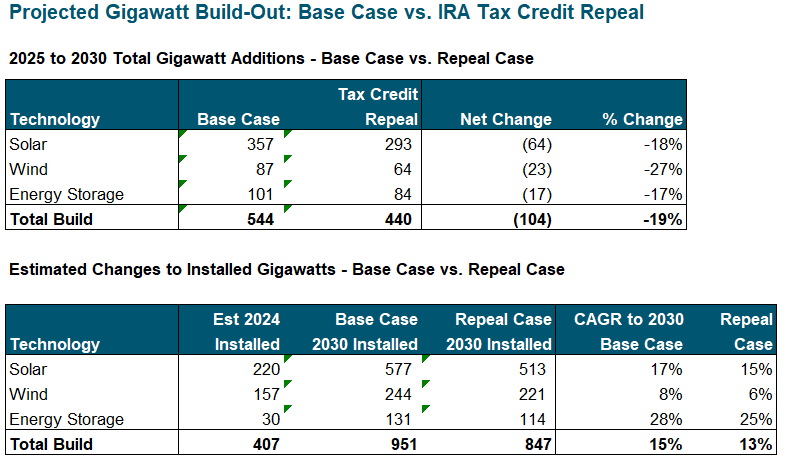
BloombergNEF (BNEF) recently analyzed the implications of repealing key clean energy incentives (see Figure 2). Their comparison of two scenarios—one where the current policy framework remains in place and one where the IRA tax credits are completely repealed—suggests that a full-repeal scenario would result in a significant decline in solar, wind and energy storage deployments through 2030. However, even with these potential setbacks, BNEF still expects high growth rates in key renewable sectors.
Figure 2. Limited Effects of an IRA Repeal
According to BloombergNEF, repealing the Inflation Reduction Act tax credits would reduce aggregate solar, wind and energy storage buildouts over the next five years by an average of 19% compared to a no-repeal base case. However, given the momentum behind renewables, the total installed base of solar, wind and energy storage would continue to grow and more than double over the period.
Source: BloombergNEF. Data as of 12/31/2024. Included for illustrative purposes only. Past performance is no guarantee of future results.
Even with unified Republican control in the U.S. in 2025, a full repeal of existing clean energy legislation appears unlikely. Several factors mitigate against such a scenario. First, existing policies have spurred substantial investments in clean energy manufacturing and deployment, including many in politically important red states. These investments translate into jobs and economic growth, making a full repeal politically challenging. Second, public opinion polls consistently show strong bipartisan support for clean energy technologies. Third, the clean energy industry has created significant momentum as companies make long-term investments based on existing incentives.
While a full repeal of clean energy policies faces significant hurdles, partial modifications or targeted revisions remain plausible in 2025. However, these adjustments could be complex due to the interconnected nature of existing legislation and the likelihood that targeting specific elements could have unintended consequences. As the political landscape continues to shift, future legislative changes cannot be ruled out. However, it appears likely that the core of the current clean energy framework will endure through 2025, with only incremental adjustments at the margins. The worst fears of climate policy rollbacks may, therefore, be overstated.
#5. More Market Volatility Ahead
The confluence of opposing forces makes it difficult to forecast markets in 2025. Widely ranging bull and bear outlooks appear plausible. However, one thing seems certain: volatility will be a key characteristic of the year ahead.
Potential catalysts for extreme market movements in 2025 are both numerous and intertwined. In a bull scenario, a technological boom driven by artificial intelligence (AI) is amplified by tax cuts, deregulation and stimulative policies. Corporate earnings growth continues higher. The surge in productivity and innovation attracts massive capital flows into the U.S. from the rest of the world. This is reinforced by record corporate share buybacks, generating economic optimism and driving asset prices higher. Portions of the equity markets are already discounting this possibility.
Market volatility will dominate in 2025, driven by political shifts, inflation and geopolitical tensions.
However, the bond market has begun to price in a ballooning government deficit and increased U.S. Treasury bond issuance. This has sent long-end bond yields higher, widening the term premium and driving up real yields. A rising U.S. dollar could exacerbate pressures on emerging markets and global trade. Additionally, a continued rise in the neutral rate of interest16 would further constrain economic growth. Policy uncertainty stemming from potential political shifts or unexpected events could dampen investor confidence.
The specter of aggressive tariffs and renewed trade wars, driven by rising protectionism and competitive currency devaluations, also casts a long shadow on risk assets. Persistent sticky inflation could force the U.S. Federal Reserve into a more hawkish17 stance than the markets expect. This might lead to a pause in interest rate cuts or even further rate hikes. Geopolitical tensions, fueled by rising populism and nationalism globally, could further destabilize markets.
#6. Fourth Industrial Revolution’s Endless Energy Demands
The year 2024 was transformative for global energy markets. Many converging forces reshaped demand across power systems, grid infrastructure and critical materials. Rapid technological evolution, continuing energy transition and the accelerating industrialization of emerging economies will further define the landscape in 2025, underscoring the need for strategic investments to meet these unprecedented challenges.
The 4IR will reshape energy consumption and intensify the focus on nuclear energy as a sustainable solution.
The energy transition may face headwinds in the U.S. due to the incoming Republican administration. However, the impact of climate policy rollbacks may be less significant than anticipated. It could be overshadowed by emerging tailwinds from the Fourth Industrial Revolution, one defined not only by the integration of renewable energy and energy storage but by innovative smart electricity grids, decentralized energy systems, AI advancements and industrial innovation. Strong global growth in renewables is still projected despite political headwinds.
AI is expected to become an ever more important driver of energy demand. The power requirements of data centers, machine learning models and digital infrastructure are soaring as industries adopt increasingly complex AI systems. This has intensified the focus on nuclear energy as a sustainable solution for powering AI’s exponential growth. As a zero-emission, baseload energy source, nuclear power is uniquely positioned to support the AI revolution while advancing global decarbonization efforts. In 2025, we foresee accelerated investment in both AI-driven applications and nuclear energy infrastructure as their synergies become more apparent. For example, Microsoft recently announced plans to invest $80 billion to build out AI-enabled data centers. Such investments from leading tech firms should benefit critical materials in the coming years.
Urbanization and industrialization in emerging economies will be another pivotal theme in energy demand in 2025. These regions are rapidly building infrastructure, expanding manufacturing capabilities and improving living standards. Their growing energy needs will intensify the demand for electricity, transport and construction materials.
The convergence of these trends points to a structural increase in energy demand and a critical need for grid modernization. The world is entering a transformative era where energy and critical materials are not just inputs but enablers of economic progress. In our view, these dynamics should solidify the foundation for a new wave of industrial growth in 2025. They underscore the importance of strategic planning and investment in the global energy and commodities sectors. This new wave of industrialization, combined with persistent supply constraints in commodities, could trigger a new commodity supercycle, specifically for critical materials.
Critical Materials
#7. Uranium Fundamentals Keep Getting Stronger
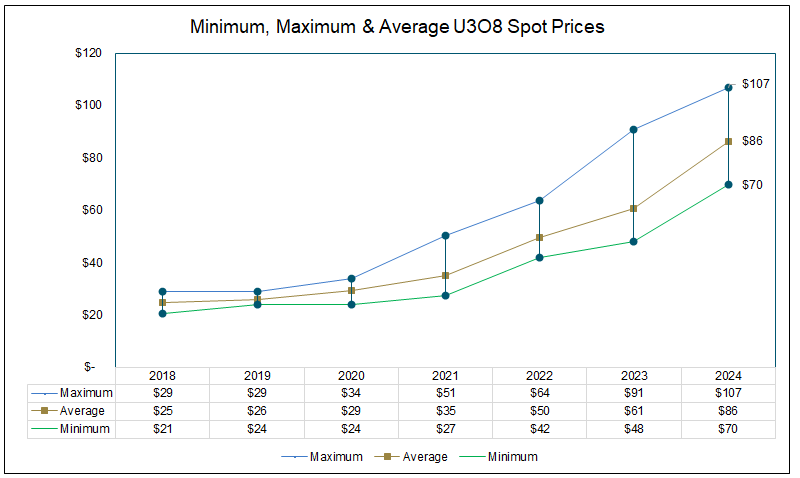
We believe the uranium market is poised for continued growth in 2025 as it continues its bull18 cycle. Following 2023’s nearly 90% price increase, the market experienced healthy consolidation in 2024, with the spot price falling -19.67%. The underlying price environment is strong—minimum, average and maximum spot prices in 2024 were all higher than in recent years (see Figure 3). In the term market, where uranium miners predominantly contract, the price hit a 16-year high in 2024. Regardless of spot price movements, uranium’s underlying fundamentals continue to grow stronger, driven by accelerating demand, supply constraints and favorable nuclear energy policies.
We see a bullish uranium market despite recent price dips, boosted by strong demand and persistent supply challenges.
The nuclear energy sector, backed by bipartisan political support, is undergoing a resurgence that may gain further momentum in 2025. Reactor restarts, life extensions and new builds are underway, and 31 countries recently endorsed the declaration at COP29 to triple nuclear energy by 2050. Nuclear’s critical role in delivering reliable, clean and safe energy is increasingly apparent at both the national level and within the technology sector. Energy-intensive applications like AI and data centers are prompting tech firms to turn to nuclear energy. Microsoft’s 20-year power purchase agreement to support reopening the Three Mile Island nuclear plant in the U.S. exemplifies this trend. Surging energy demand is driven not only by AI and manufacturing reshoring in the West but also by urbanization and industrialization in the East and the global energy transition. We believe nuclear energy is well-positioned in 2025.
Conversely, current global uranium mine production remains insufficient to meet the world’s reactor requirements, creating a structural supply deficit. Numerous junior uranium miners are restarting mines in response to historically high uranium prices, but this is unlikely to close the supply-demand gap. No major new production is expected in the next three to five years, so the imbalance may deepen and place further strain on the market.
Meanwhile, geopolitical instability in key production regions like Niger continues to disrupt supply chains, while Russia’s retaliatory ban on enriched uranium exports adds to the uncertainty. Kazakhstan’s chronic inability to meet production guidelines—including the surprise suspension of production at the Inkai joint venture—underscores the importance of supply security. Given the concentration of uranium supply in a few regions, geopolitical risks are likely to remain a significant factor in 2025.
Long-term contracting is another critical area to watch. Larger term contracts were signed in 2023, but the overall numbers likely disguise a bifurcated market. Some utilities are well-covered, while others have ignored the signals and failed to adapt procurement strategies to the new market realities. Further, term contracting in 2024 looks to be well below the replacement rate, which increases the urgency for more contracting going forward. We believe that available-for-sale inventories, critical to utilities, have been depleted. Utilities' needs may cascade down the supply chain from conversion and enrichment, where prices are hitting all-time highs, to U3O8 itself.
The recent price correction in spot uranium and miner stocks may be an attractive entry point for investors in the ongoing bull market. Persistent supply deficits, along with geopolitical uncertainties and the lack of new mine supply, suggest limited near-term relief. In contrast, robust demand growth, bolstered by government policies and private-sector investment, provides strong support for sustained price appreciation in the uranium market.
Figure 3. Robust Price Environment for Uranium (2018-2024)
Last year, the 20% fall in the uranium spot price looks like a consolidation since market fundamentals are favorable and the underlying price environment is strong. The average and maximum uranium spot prices in 2024 were at their highest levels in the last six years.
Source: UxC LLC. U308 spot price, $/lb. Data as of 12/31/2024. Daily data were used from 2021 onwards, and weekly data were used prior (representing the greatest frequency available). Past performance is no guarantee of future results.
#8. Copper’s Demand-Supply Imbalance Widens
Copper began 2024 on a strong note, fueled by increasingly positive fundamentals and investor sentiment, but the second half of the year proved challenging. The spot price gained only 2.23% overall during the year. However, copper demonstrated remarkable resilience compared to other commodities, many of which experienced significant negative performance.
Copper is a cornerstone of the world’s surging energy demand, which we believe positions it strategically for a dynamic 2025. The market faces escalating supply-demand deficits as energy-intensive applications grow in the face of persistent supply-side constraints. Copper’s role keeps evolving due to shifts in traditional demand patterns and a structural recalibration of its economic importance.
Despite 2024's price challenges, copper's role in AI, energy transition and emerging economies position it for a potentially strong 2025.
The demand side of copper is undergoing a significant transformation. Copper was traditionally seen as an economic bellwether but is now more synchronized with structural growth sectors like AI, the energy transition, and the urbanization and industrialization of developing countries. AI and data centers, which rely heavily on copper for infrastructure, represent a new and significant demand driver. Copper’s new omnipresence in the energy-intensive future of global economies may shield it from tariffs proposed by the incoming Trump administration, a threat that has been weighing on the copper market post-election.
Copper demand is also becoming less reliant on traditional sectors like the Chinese property market. While China remains a critical player, copper demand has diverged from its historical ties to broader industrial commodities, like iron ore, which it outperformed by almost 30% in 2024. We expect this trend to continue. The Chinese property sector is experiencing a downturn, but Chinese government spending on copper-intensive infrastructure—such as grid upgrades, EVs and renewable energy—continues to provide a strong foundation for demand.
On the supply side, copper faces many challenges that constrain production and exacerbate the market deficit. Declining ore grades, supply disruptions and long project lead times continue to hinder output. Production disruptions, a recurring theme in 2024, are expected to persist in the coming quarters. The lack of sufficient investment in future copper supply remains a critical bottleneck. Despite strong demand forecasts, the capital intensity and lengthy timelines associated with new mine development have limited the sector's ability to respond. The tighter availability of copper concentrate is likely to put further upward pressure on prices. Meanwhile, overcapacity in the smelting sector adds pressure to the upstream segment of the supply chain and may continue to depress treatment charges. As these forces persist, we believe copper’s fundamentals will remain firmly bullish, with supply deficits widening through 2025 and beyond.
In our view, pure-play copper miners are well-positioned to benefit from these trends due to their operating leverage to potential increases in the copper spot price. Additionally, the mining sector remains broadly profitable, supported by healthy margins and robust demand tailwinds.
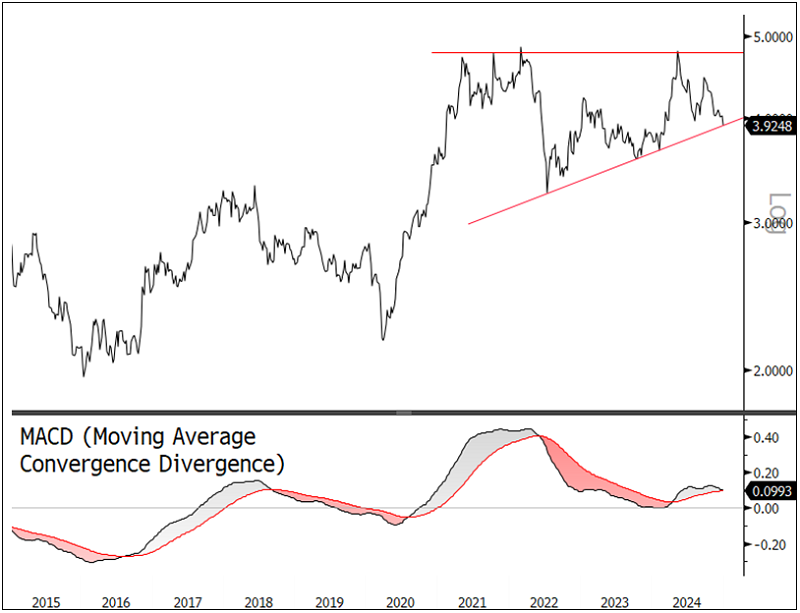
Copper’s evolving narrative in 2025 highlights its central role in the electrified and digitalized future of global economies. As confidence in these sectors grows, restocking through the supply chain may accelerate, further supporting prices. With its strong fundamentals and growing strategic importance, we think copper remains one of the most compelling commodities for the year ahead. The strength of the market is also underscored by copper’s textbook bullish ascending triangle chart pattern (see Figure 4).
Figure 4. Copper Price: Technicals Signal Strength (2015-2024)
The copper price struggled to make headway in the second half of 2024, but its solid fundamentals and rising strategic importance point to growth in 2025. In addition, the ascending triangle pattern in Figure 4 is a bullish technical signal that testifies to the market’s strength.
Source: Bloomberg. Copper spot price, $/lb. Data as of 12/31/2024. Moving average convergence/divergence is a trend-following momentum indicator that shows the relationship between two exponential moving averages (EMAs), calculated by subtracting the 26-period EMA from the 12-period EMA. Included for illustrative purposes only. Past performance is no guarantee of future results.
Precious Metals
#9. Central Banks Want Even More Gold
Gold experienced an impressive 27.22% surge in 2024, its best performance since 2010 and third best since 1980. On technical charts, gold broke out of a multi-year consolidation, indicating a new long-term bullish trend. Notably, aggressive buying by central banks and sovereign entities has counteracted the historically negative effects of high bond yields and a strong U.S. dollar on gold prices.
We expect robust demand from the official sector—central banks and sovereigns—to continue to drive gold prices in 2025. Since the second quarter of 2022, central bank quarterly gold purchases have averaged 287 tonnes, a 2.3-fold increase compared to the previous decade's quarterly average of 127 tonnes. In June 2024, the World Gold Council’s Central Bank Gold Survey noted that central bank respondents intended to increase their gold reserves over the following 12 months. Central banks are motivated by gold's multiple roles as a long-term store of value, inflation hedge, safe haven during crises and portfolio diversifier, all without default risk. Their views are particularly relevant in the context of heightened geopolitical tensions and macroeconomic stress. Other top concerns for central banks include interest rate levels, inflation and geopolitical instability.
Gold surged 27.22% in 2024, driven by strong central bank buying and breaking a multi-year consolidation.
Emerging markets and developing economies (EMDEs)—the fastest-growing buyers of gold—are particularly vulnerable to these factors. EMDEs prioritize gold as a hedge against shifts in global economic power, systemic financial risk, political risk, sanctions and potential changes in the international monetary system. Both EMDEs and advanced economies value gold for portfolio diversification, crisis performance and liquidity. Among central banks' typical reserve holdings, which include sovereign currencies and bonds, gold plays a unique and growing strategic role in reserve management and stabilization.
Most central banks expect the U.S. dollar to decline as a proportion of their total reserves, with gold’s share expected to rise over the next five years. This trend has intensified since 2022 and is also evident in advanced economies reducing their dollar holdings. The U.S. dollar will hold its position as the primary reserve currency, but its influence will likely diminish due to concerns about “dollar weaponization" and the rise of alternative currencies and bilateral agreements. Central banks increasingly view gold as a strategic asset. We expect this trend to continue in 2025.
Central bank policies, inflation and geopolitics will likely continue to support gold prices in 2025. Central bank buying and investor hedging are sources of robust demand, while geopolitical risk could increase gold investment from investment funds. Renewed inflationary pressures—especially from tariffs and trade wars— would be a positive demand vector for gold. Asian demand is likely to be influenced by Chinese stimulus, economic growth, property markets and currency devaluation, while Indian demand is expected to remain resilient.
Figure 5. Gold Breaking Out (2015-2024)
Gold surged in 2024 as central banks and sovereigns continued to buy aggressively. Technically, gold has broken out of a multi-year consolidation, which indicates a new long-term bullish trend.
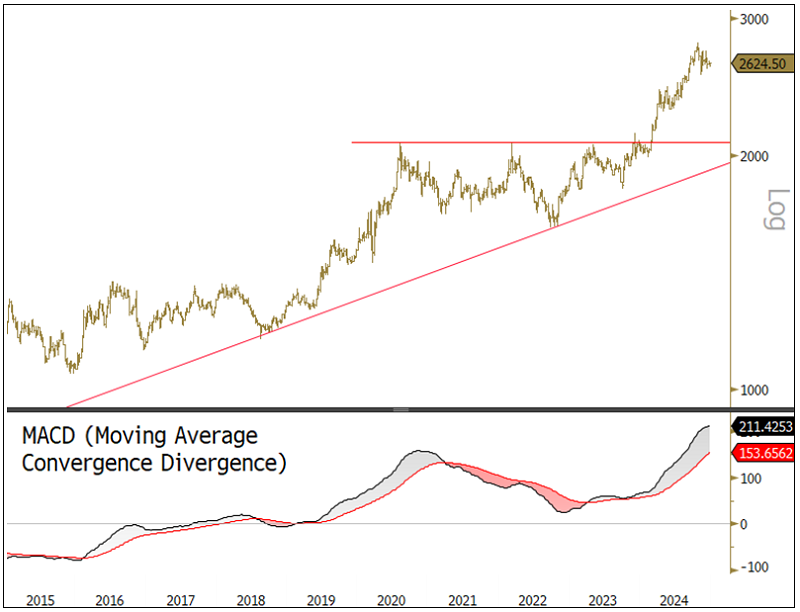
Source: Bloomberg. Gold spot price, $/oz. Data as of 12/31/2024. Moving average convergence/divergence is a trend-following momentum indicator that shows the relationship between two exponential moving averages (EMAs), calculated by subtracting the 26-period EMA from the 12-period EMA. Included for illustrative purposes only. Past performance is no guarantee of future results.
#10. Silver Is Positioned for New Gains
Silver performed strongly in 2024, rising 21.46% and breaking out of a multi-year consolidation range. The metal demonstrated its enduring monetary value, maintaining a high correlation with gold prices despite headwinds from higher real interest rates and a strong U.S. dollar. Investor sentiment toward silver also improved, as reflected in CFTC and ETF positioning.19 For 2025, silver's price outlook will be shaped by its sustained correlation to gold and its supply and demand dynamics. Silver's technical chart pattern (see Figure 6) suggests the potential for higher prices in 2025, aligning with positive fundamental factors.
Silver's robust performance in 2024 underscores its enduring value as a monetary asset, with investor sentiment improving throughout the year.
News headlines have focused on potential demand risks for silver, especially from a weaker Chinese domestic market and the threat of tariffs, particularly on solar panel imports. However, the more pressing issue for 2025 may lie on the supply side. A significant portion of silver supply (~80%) is a by-product of lead-zinc and other metal mining. If demand for lead and zinc weakens in China, as some forecasts suggest, it could lead to a corresponding decline in silver supply, creating upward pressure on prices. This supply-side vulnerability is a key development to watch in 2025.
On the demand side, several factors are expected to support silver prices in 2025. Changes in global monetary policy, continued global economic recovery, and increasing industrial demand from solar energy and electrification are all projected to contribute to strong silver demand. Reshoring of solar panel production and a continuing decline in solar energy costs due to technological advancements are likely to offset the negative effects of possible tariffs on Chinese solar panels. Despite potential cuts to subsidies, the rate of solar energy adoption should remain strong in 2025, further bolstering silver demand. Solar energy costs are now significantly below those of traditional energy sources like coal and natural gas. This makes solar energy highly competitive, especially when coupled with battery storage to eliminate its last weakness, power intermittency.
Figure 6. Silver Is Patterned for Price Gains (2015-2024)
Silver performed strongly in 2024, maintaining its high correlation with gold despite countervailing pressure from higher interest rates and a rampant U.S. dollar. Market fundamentals are firm. Technically, silver broke out of a multi-year consolidation range in 2024, and its chart pattern indicates potentially higher prices in 2025.
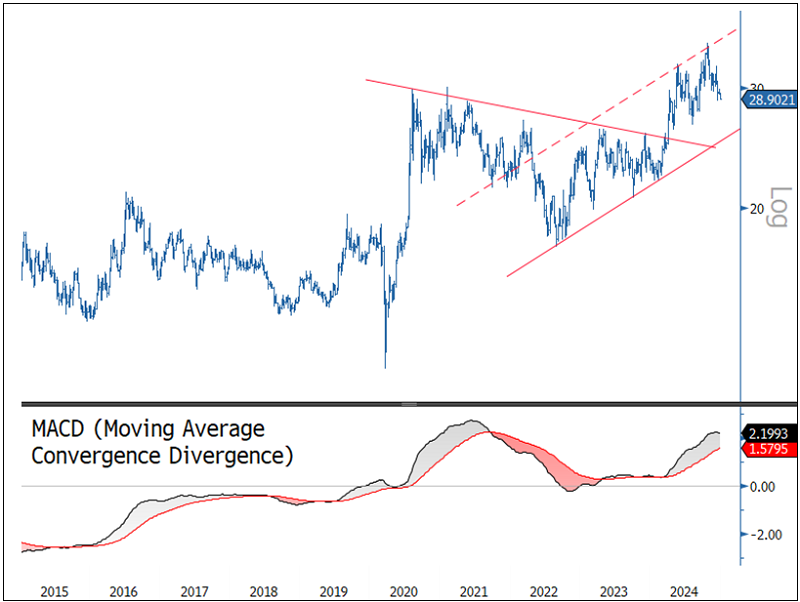
Source: Bloomberg. Silver spot price, $/oz. Data as of 12/31/2024. Moving average convergence/divergence is a trend-following momentum indicator that shows the relationship between two exponential moving averages (EMAs), calculated by subtracting the 26-period EMA from the 12-period EMA. Included for illustrative purposes only. Past performance is no guarantee of future results.
Critical Materials: 2024 Performance
| Metric | 12/31/2024 | 12/31/2023 | Change | YTD % Chg | Analysis |
| Miners | |||||
| Nasdaq Sprott Critical Materials™ Index1 | 849.53 | 985.91 | (136.39) | (13.83)% |
The Nasdaq Sprott Critical Materials Index fell 13.83% in 2024, as the lithium and nickel groups fell for a third straight year. Copper outperformed, as supply-demand balances remained positive. Uranium fell/paused after a +58% return in 2023. After peaking in May, the critical materials group retreated as economic data from China continued to deteriorate after a promising start. The second down thrust came after the Trump election victory as concerns over the repeal of the IRA mounted. |
| Nasdaq Sprott Lithium Miners™ Index2 | 408.60 | 736.47 | (327.87) | (44.52)% | |
| North Shore Global Uranium Mining Index3 | 3,342.43 | 3,846.25 | (503.82) | (13.10)% | |
| Solactive Global Copper Miners Index4 | 1,101.10 | 1,046.28 | 54.82 | 5.24% | |
| Nasdaq Sprott Nickel Miners™ Index5 | 513.55 | 661.01 | (147.46) | (22.31)% | |
| Nasdaq Sprott Junior Copper Miners™ Index6 | 1,067.70 | 967.43 | 100.26 | 10.36% | |
| NYSE Arca Gold Miners Index | 956.60 | 876.44 | 80.16 | 9.15% | |
| Nasdaq Sprott Junior Uranium Miners™ Index7 | 1,213.77 | 1,454.75 | (240.98) | (16.57)% | |
| Physical Materials | |||||
| Lithium Carbonate Spot Price $/lb8 | 4.69 | 6.16 | (1.47) | (23.89)% |
Gold had its best year, +27.22% in 2024, since 2010 and one of its best years ever since 1980, as central banks continued to buy while selling dried up. Silver rose 21.46%, breaking out to new 10-year highs. |
| U3O8 Uranium Spot Price $/lb9 | 73.00 | 91.00 | (18.00) | (19.78)% | |
| LME Copper Spot Price $/lb10 | 3.92 | 3.84 | 0.09 | 2.23% | |
| LME Nickel Spot Price $/lb11 | 6.85 | 7.43 | (0.57) | (7.72)% | |
| Gold Spot Price $/oz | 2,624.50 | 2,062.98 | 561.52 | 27.22% | |
| Silver Spot Price $/oz | 28.90 | 23.80 | 5.11 | 21.46% | |
| Benchmarks | |||||
| S&P 500 TR Index12 | 5,881.63 | 4,769.83 | 1,111.80 | 23.31% |
The S&P 500 posted consecutive +20% return years in 2024, only the fifth in time in history. Equity markets surged on earnings growth, Fed rate cuts, a strong economy, record inflows, etc., despite yields rising and the USD surging. |
| DXY US Dollar Index13 | 108.49 | 101.33 | 7.15 | 7.06% | |
| BBG Commodity Index14 | 98.76 | 98.65 | 0.12 | 0.12% | |
| US Treasury Total Return Index15 | 2,290.24 | 2,277.09 | 13.15 | 0.58% | |
*Mo % Chg and YTD % Chg for this Index are calculated as the difference between the month end's yield and the previous period end's yield, instead of the percentage change. BPS stands for basis points.
- For the latest standardized performance of the Sprott ETFs, please visit the individual website pages: SGDM, SGDJ, SLVR, SETM, LITP, URNM, URNJ, COPP, COPJ and NIKL. Past performance is no guarantee of future results.
Footnotes
| 1 | The Nasdaq Sprott Critical Materials™ Index (NSETM™) is designed to track the performance of a selection of global securities in the critical materials industry, and was co-developed by Nasdaq® and Sprott Asset Management LP. |
| 2 | The Nasdaq Sprott Lithium Miners™ Index (NSLITP™) is designed to track the performance of a selection of global securities in the lithium industry, including lithium producers, developers and explorers; the index was co-developed by Nasdaq® and Sprott Asset Management LP. |
| 3 | The North Shore Global Uranium Mining Index (URNMX) is designed to track the performance of companies that devote at least 50% of their assets to the uranium mining industry, which may include mining, exploration, development and production of uranium, or holding physical uranium, owning uranium royalties or engaging in other non-mining activities that support the uranium mining industry. |
| 4 | The Solactive Global Copper Miners Index includes international companies active in exploration, mining and/or refining of copper. The index includes a minimum of 20 and a maximum of 40 members. The calculation is done in USD as a total return index. Index adjustments are carried out semi-annually. |
| 5 | Nasdaq Sprott Nickel Miners™ Index (NSNIKL™) is designed to track the performance of a selection of global securities in the nickel industry. |
| 6 | Nasdaq Sprott Junior Copper Miners™ Index (NSCOPJ™) is designed to track the performance of mid-, small- and micro-cap companies in copper-mining related businesses. |
| 7 | Nasdaq Sprott Junior Uranium Miners™ Index (NSURNJ™) is designed to track the performance of mid-, small- and micro-cap companies in uranium-mining related businesses. |
| 8 | The lithium carbonate spot price is measured by the China Lithium Carbonate 99.5% DEL. Source Bloomberg and Asian Metal Inc. Ticker L4CNMJGO AMTL Index. Data converted to pounds and to USD with Bloomberg FX Rates. |
| 9 | The U3O8 uranium spot price is measured by a proprietary composite of U3O8 spot prices from UxC, S&P Platts and Numerco. |
| 10 | The copper spot price is measured by the LME Copper Cash ($). Source Bloomberg ticker LMCADY. Data converted to pounds. |
| 11 | The nickel spot price is measured by the LME Nickel Cash ($). Source Bloomberg ticker LMNIDY. Data converted to pounds. |
| 12 | The S&P 500 or Standard & Poor's 500 Total Return Index is a market-capitalization-weighted index of the 500 largest U.S. publicly traded companies. |
| 13 | The U.S. Dollar Index (USDX, DXY) is an index of the value of the U.S. dollar relative to a basket of foreign currencies. |
| 14 | The Bloomberg Commodity Index (BCOM) is a broadly diversified commodity price index that tracks prices of futures contracts on physical commodities, and is designed to minimize concentration in any one commodity or sector. It currently has 23 commodity futures in six sectors. |
| 15 | The S&P Metals & Mining Select Industry Index comprises stocks in the S&P Total Market Index that are classified in the GICS metals & mining sub-industry. |
| 16 | The neutral or "natural rate of interest" is a theoretical interest rate that would exist when an economy is operating at full employment with stable inflation, essentially a level where monetary policy is neither stimulating nor contracting the economy. It is considered the ideal real interest rate for long-term economic stability, often represented by "r*" in economic literature. |
| 17 | Hawkish describes an inflation hawk, or a policy maker or advisor who prioritizes controlling inflation and may favor higher interest rates to keep it in check (Investopedia). Bull, bullish, or bull market are terms used to describe a financial market in which prices are rising or are expected to rise. |
| 18 | Bull, bullish or bull market are terms used to describe a financial market in which prices are rising or are expected to rise. |
| 19 | The two largest subsets of gold held for investment purposes are gold in ETFs and gold held by speculative traders on U.S. futures exchanges as shown by the CFTC gold non-commercial net positions report. |
Important Disclosures
An investor should consider the investment objectives, risks, charges and expenses of each fund carefully before investing. To obtain a fund’s Prospectus, which contains this and other information, contact your financial professional, call 1.888.622.1813 or visit SprottETFs.com. Read the Prospectus carefully before investing.
Exchange Traded Funds (ETFs) are considered to have continuous liquidity because they allow for an individual to trade throughout the day, which may indicate higher transaction costs and result in higher taxes when fund shares are held in a taxable account.
The funds are non-diversified and can invest a greater portion of assets in securities of individual issuers, particularly those in the natural resources and/or precious metals industry, which may experience greater price volatility. Relative to other sectors, natural resources and precious metals investments have higher headline risk and are more sensitive to changes in economic data, political or regulatory events, and underlying commodity price fluctuations. Risks related to extraction, storage and liquidity should also be considered.
Shares are not individually redeemable. Investors buy and sell shares of the funds on a secondary market. Only “authorized participants” may trade directly with the fund, typically in blocks of 10,000 shares.
The Sprott Active Metals & Miners ETF, Sprott Active Gold & Silver Miners ETF and the Sprott Silver Miners & Physical Silver ETF are new and have limited operating history.
Sprott Asset Management USA, Inc. is the Investment Adviser to the Sprott ETFs. ALPS Distributors, Inc. is the Distributor for the Sprott ETFs and is a registered broker-dealer and FINRA Member. ALPS Distributors, Inc. is not affiliated with Sprott Asset Management USA, Inc.


