Performance as of December 31, 2022
| Asset | 1 MO* | 3 MO* | Year 2022 |
|
U3O8 Uranium Spot Price 1 |
-2.27% | 0.12% | 14.74% |
|
Uranium Mining Equities (Northshore Global Uranium Mining Index) 2 |
-4.87% | -2.44% | -11.42% |
|
Commodities (BCOM Index) 3 |
-2.80% | 1.18% | 13.75% |
|
U.S. Equities (S&P 500 TR Index) 4 |
-5.76% | 7.56% | -18.11% |
|
U.S. Bonds (Bloomberg Barclays US Agg Total Return Value Unhedged USD Index) 5 |
-0.45% | 1.87% | -13.01% |
Sources: Bloomberg and Sprott Asset Management LP. Data as of December 31, 2022.
*Performance for periods under one year not annualized. Past performance is no guarantee of future results.
December Performance
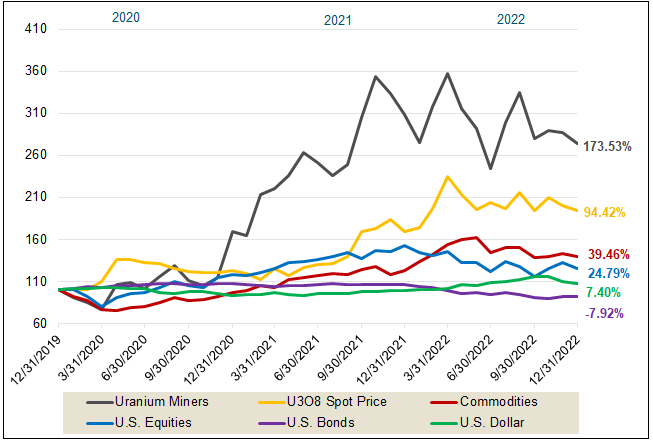
Most asset classes lost ground in December, including broad equity markets, bond markets and most commodities, including uranium. The U3O8 uranium spot price fell from $49.43 to $48.31 per pound in December, a 2.27% decrease, while uranium mining stocks lost 4.87% for the month. For the full year 2022, uranium performance was notably strong, given the overall bear market environment. The U3O8 spot price returned 14.74% for the twelve months, outperforming most asset classes. In contrast, however, uranium mining equities fell 11.42% for 2022. Even so, the fundamentals for uranium and nuclear energy strengthened throughout 2022, a year notably impacted by rising inflation and higher interest rates. We believe the positive developments in the uranium and nuclear power sectors will continue to provide long-term structural support for uranium and uranium miners in 2023.
Figure 1. Uranium Outperforms Other Asset Classes in the Short Term (12/31/2019-12/31/2022)

Source: Bloomberg and Sprott Asset Management. Data as of 12/31/2022. Uranium Miners are measured by the Northshore Global Uranium Mining Index (URNMX index); U.S. Equities are measured by the S&P 500 TR Index; the U308 Spot Price is measured by a proprietary composite of U3O8 spot prices from TradeTech; U.S. Bonds are measured by the Bloomberg Barclays US Agg Total Return Value Unhedged USD Index (LBUSTRUU); Commodities are measured by the Bloomberg Commodity Index (LLCBCOM); and the U.S. Dollar is measured by DXY Curncy Index. You cannot invest directly in an index. Included for illustrative purposes only. Past performance is no guarantee of future results.
Governments Worldwide are Embracing Nuclear Power
December saw a continuation of the positive global news flow on uranium and nuclear energy. Japan continued its historic U-turn on nuclear energy policy and adopted a plan to “maximize the use of existing reactors by restarting as many of them as possible and prolonging the operating life of aging ones beyond the current 60-year limit.” 6 Further, Japan plans to build new reactors to replace decommissioned ones. In India, the government approved five new nuclear power plant sites and financing to build ten 700-MW nuclear reactors.7 Prime Minister Modi has previously said that India aims to triple its nuclear fleet over the next decade. Finally, in Canada, the government released its Canadian Critical Minerals Strategy, which is backed by nearly CA$ 4 billion to increase the supply of responsibly sourced critical minerals, including uranium.8 The strategy announced multiple commitments, including a 30% Critical Mineral Exploration Tax Credit for targeted critical minerals, which will likely support Canadian uranium explorers.
The U.S. Federal Strategic Uranium Reserve awarded its first contracts to Energy Fuels Inc., Uranium Energy Corp., Peninsula Energy Ltd., Encore Energy Corp. and Ur-Energy Inc.9,10 The initial $75 million financial commitment to the reserve is designed to ensure the security of supply for U.S. nuclear power plants and incentivize domestically produced uranium. Although the contract awards in pounds are not material, the prices paid by the U.S. government for the uranium were as high as $70 per pound. Given that current spot prices are approximately $50, we believe that this excess price paid for U.S.-origin material reflects the growing concerns by the U.S. Department of Energy about continuing to rely on Russian and other non-friendly countries for critical supply chains.
Kazatomprom, located in Kazakhstan, is the largest uranium miner in the world by uranium production and was one of the few uranium miners with positive performance over the month. The miner announced that it completed a uranium delivery through its Trans-Caspian International Transport Route.11 This was significant as Kazatomprom’s primary shipping route is from Kazakhstan through St. Petersburg, Russia. Although there are still no restrictions on the supply that transports through Russia, given potential sanctions, the successful shipment through an alternative route mitigates the risk of potential shipping disruptions via Russia.
Three Key Trends for 2023
1. Prioritizing Energy Security as Countries Reduce Reliance on Russia
Nuclear energy and uranium’s critical role in energy security may likely be paramount in 2023 and beyond. On February 24, 2022, Russia invaded Ukraine, sparking a global energy crisis. The cost of this energy crisis has been enormous, at $1 trillion for Europe, from the invasion date to December.12 Further, the predicament will be far from over in 2023 as, after winter, countries will have to refill gas reserves without Russian supplies.
In past years, Western countries’ energy policies have predominantly favored renewable energy. However, governments cannot rely on renewable energy alone to reduce dependence on Russia due to renewables' intermittency and low-capacity factor. The intermittency of renewables can only be offset with baseload energy sources, such as coal, natural gas or nuclear power plants.
Considering decarbonization targets, we expect nuclear energy to be a cornerstone in energy policies for many countries going forward. The challenge for governments and utilities will be securing ample uranium supply, especially if Russia sources are curtailed. For example, the European Commission is discussing a ban on new investments in Russia’s mining sector.13 For investors in the sector, disruptions in supply chains may cause utilities to increase inventories and advance procurement plans, ultimately bolstering uranium demand and prices.
2. Higher Conversion and Enrichment Prices Likely to Elevate U3O8 Uranium Spot Price
Prices for uranium conversion and enrichment services more than doubled in 2022, a significant outperformance relative to the U3O8 uranium spot price. We believe this upward price pressure will cascade down to the uranium spot price in 2023.
While Russia accounts for a small portion of U3O8 production at 6% of the global total, it controls about 27% of the global uranium conversion capacity and 39% of fuel enrichment.14 Although there have yet to be sanctions on either Russian uranium or conversion and enrichment services, and legacy contracts are being honored, utilities are not signing any new contracts with Russian entities. In response, Western countries are investing in and supporting the expansion of local conversion and enrichment capacity.
A key development expected in the first half of 2023 is the restart of the U.S. conversion facility, ConverDyn. This shift to Western conversion and a lack of enrichment capacity is the bottleneck for higher uranium demand. Once new conversion capacity comes online, we anticipate an industry shift from underfeeding to overfeeding (using more UF6 as feedstock to produce more enriched uranium) should significantly increase uranium demand in 2023 and beyond, which is ultimately supportive of uranium miners. Further, “available for sale” uranium inventories have mostly been sold and may likely not act as a significant source of secondary supply as in the past couple of years.
3. The Global Energy Transition to Reduce Reliance on Fossil Fuels
The energy transition movement is structural, and the reality is that nuclear energy is crucial for many countries to reliably decarbonize their energy supply. Growing global recognition of this by governments, catalyzed by the need for greater energy security, is likely to continue to be a dominant theme and driver in 2023.
The European Union (EU), Japan and South Korea launched green taxonomies in 2022, including nuclear energy. The EU taxonomy came into effect on January 1, 2023, and allows nuclear energy to be labeled as “green investments”. Nuclear activities included in the taxonomy, such as extensions of existing reactor lifespans, will take effect and strengthen the demand for uranium. In the U.S., the Inflation Reduction Act, Civil Nuclear Credit Program and the U.S. Federal Strategic Uranium Reserve will give financial support to nuclear power plants, allowing them to compete more effectively versus other energy sources. In China and India, we expect to see continued progress toward the build-out of new nuclear reactors.
We believe the uranium bull market remains intact despite the challenging and uncertain macroeconomic environment. There has been an unprecedented number of announcements for nuclear power plant restarts, life extensions and new builds that are likely to create incremental demand for uranium. However, the current uranium price still remains below incentive levels to restart tier 2 production, let alone greenfield development. Over the long term, increased demand in the face of an uncertain uranium supply may likely support a sustained bull market.
Figure 2. Uranium Bull Market Continues (1968-2022)
Please click here to see an enlarged chart.
Note: A “bull market” refers to a condition of financial markets where prices are generally rising. A “bear market” refers to a condition of financial markets where prices are generally falling.
Source: TradeTech Data as of 12/31/2022.
Footnotes
| 1 | The U3O8 uranium spot price is measured by a proprietary composite of U3O8 spot prices from UxC, S&P Platts and Numerco. |
| 2 | The North Shore Global Uranium Mining Index (URNMX) was created by North Shore Indices, Inc. (the “Index Provider”). The Index Provider developed the methodology for determining the securities to be included in the Index and is responsible for the ongoing maintenance of the Index. The Index is calculated by Indxx, LLC, which is not affiliated with the North Shore Global Uranium Miners Fund (“Existing Fund”), ALPS Advisors, Inc. (the “Sub-Adviser”) or Sprott Asset Management LP (the “Adviser”). |
| 3 | The Bloomberg Commodity Index (BCOM) is a broadly diversified commodity price index that tracks prices of futures contracts on physical commodities, and is designed to minimize concentration in any one commodity or sector. It currently has 23 commodity futures in six sectors. |
| 4 | The S&P 500 or Standard & Poor's 500 Index is a market-capitalization-weighted index of the 500 largest U.S. publicly traded companies. |
| 5 | The Bloomberg US Agg Index is a broad-based flagship benchmark that measures the investment grade, US dollar-denominated, fixed-rate taxable bond market. |
| 6 | Source: World Nuclear News, Japan adopts plan to maximise use of nuclear energy. |
| 7 | Source: Reuters, India plans to build more nuclear power plants – government. |
| 8 | Source: Government of Canada, The Canadian Critical Minerals Strategy. |
| 9 | Source: World Nuclear News, First contracts awarded for US strategic uranium reserve. |
| 10 | Source: World Nuclear News, US uranium producers announce contracts and production ramp-ups. |
| 11 | Source: World Nuclear News, Kazatomprom completes trans-Caspian uranium delivery. |
| 12 | Source: Bloomberg, Europe’s $1 Trillion Energy Bill Only Marks Start of the Crisis. |
| 13 | Source: Reuters, European Commission weighs sanctions on Russia's mining industry - FT. |
| 14 | Production of U3O8 from UxC LLC for 2021. Conversion and enrichment figures from Cameco Corp. |
Important Disclosures
An investor should consider the investment objectives, risks, charges and expenses of each fund carefully before investing. To obtain a fund’s Prospectus, which contains this and other information, contact your financial professional, call 1.888.622.1813 or visit SprottETFs.com. Read the Prospectus carefully before investing.
Exchange Traded Funds (ETFs) are considered to have continuous liquidity because they allow for an individual to trade throughout the day, which may indicate higher transaction costs and result in higher taxes when fund shares are held in a taxable account.
The funds are non-diversified and can invest a greater portion of assets in securities of individual issuers, particularly those in the natural resources and/or precious metals industry, which may experience greater price volatility. Relative to other sectors, natural resources and precious metals investments have higher headline risk and are more sensitive to changes in economic data, political or regulatory events, and underlying commodity price fluctuations. Risks related to extraction, storage and liquidity should also be considered.
Shares are not individually redeemable. Investors buy and sell shares of the funds on a secondary market. Only “authorized participants” may trade directly with the fund, typically in blocks of 10,000 shares.
The Sprott Active Metals & Miners ETF, Sprott Active Gold & Silver Miners ETF and the Sprott Silver Miners & Physical Silver ETF are new and have limited operating history.
Sprott Asset Management USA, Inc. is the Investment Adviser to the Sprott ETFs. ALPS Distributors, Inc. is the Distributor for the Sprott ETFs and is a registered broker-dealer and FINRA Member. ALPS Distributors, Inc. is not affiliated with Sprott Asset Management USA, Inc.


