Sprott Uranium Report
Higher Uranium Prices Allow Miners to Resume Production
Key Takeaways
- Physical uranium gained ground in October, while uranium miners declined; most commodities suffered in October but uranium continued to show resilience to macroeconomic factors.
- YTD, uranium is up 54.16%; senior and junior uranium miners have risen 44.85% and 32.77%, respectively.
- Uranium demand has been primarily driven by increased utility contracting, which we believe provides strong support and sustainability to higher price level.
- Looking ahead to 2040, utilities have 1.5 billion pounds of cumulative uncovered uranium requirements.
- The nuclear fuel supply chain continues to move away from Russia.
- The strength in the uranium price has improved the revenue and profit for producers and raised the prospects for further mine restarts and new builds.
Performance as of October 31, 2023: Average Annual Total Returns
| Asset | 1 MO* | 3 MO* | YTD* | 1 YR | 3 YR | 5 YR |
|
U3O8 Uranium Spot Price 1 |
1.51% | 32.50% | 54.16% | 42.50% | 35.72% | 21.27% |
|
Uranium Mining Equities (Northshore Global Uranium Mining Index) 2 |
-3.67% | 32.89% | 44.85% | 37.11% | 55.77% | 43.73% |
| Uranium Junior Mining Equities (Nasdaq Sprott Junior Uranium Miners Index TR) 3 | -4.47% | 35.32% | 32.77% | 22.93% | 57.83% | N/A |
|
Broad Commodities (BCOM Index) 4 |
-0.21% | -2.54% | -7.26% | -7.71% | 13.33% | 4.69% |
|
U.S. Equities (S&P 500 TR Index) 5 |
-2.10% | -8.25% | 10.69% | 10.14% | 10.35% | 11.00% |
*Performance for periods under one year not annualized.
Sources: Bloomberg and Sprott Asset Management LP. Data as of October 31, 2023. You cannot invest directly in an index. Included for illustrative purposes only. Past performance is no guarantee of future results.
Uranium Hits $74, Standing Firm at 12-Year Price High
The U3O8 uranium spot price gained 1.51% in October, increasing from US$73.38 to $74.48 per pound as of October 31, 2023.1 Uranium has posted a stellar 54.16% year-to-date return as of October 31, 2023, and continued to show strength and diversification relative to other commodities, which declined 7.26% (as measured by the BCOM Index).
A higher uranium price is improving the prospects for further mine restarts and new builds.
While other commodities suffered in October largely due to China’s economic weakness, a persistently strong U.S. dollar (USD) and other macroeconomic factors, uranium continues to demonstrate its lower economic sensitivity. U3O8 contracting by utilities in 2023 is not largely dependent on general inflation, rising interest rates, etc. These characteristics may strengthen uranium investments' uncorrelated performance relative to major asset classes, other commodities and enhance portfolio diversification.
Over the longer term, physical uranium and uranium equities have demonstrated significant outperformance against broad asset classes, particularly other commodities. For the five years ended October 31, 2023, the U3O8 spot price has risen a cumulative 162.28% compared to 25.76% for the broader commodities index (BCOM), as shown in Figure 1.
Figure 1. Physical Uranium and Uranium Stocks Have Outperformed Other Asset Classes Over the Past Five Years (10/31/2018-10/31/2023)

Source: Bloomberg and Sprott Asset Management. Data as of 10/31/2023. Uranium Miners are measured by the Northshore Global Uranium Mining Index (URNMX index); the S&P 500 TR Index measures U.S. Equities; the U308 Spot Price is from TradeTech; U.S. Bonds are measured by the Bloomberg Barclays US Aggregate Bond Index (LBUSTRUU); Commodities are measured by the Bloomberg Commodity Index (BCOM); and the U.S. Dollar is measured by DXY Curncy Index. Definitions of the indices are provided in the footnotes. You cannot invest directly in an index. Included for illustrative purposes only. Past performance is no guarantee of future results.
Uranium Supply: A Sellers’ Market
At the start of October, uranium had appreciated significantly by the end of September, posting its most impressive month since September 2021. The uranium spot price rose to its highest level before the Fukushima Daiichi power plant disaster in 2011, when it was $73 per pound. October saw yet another high, despite intra-month volatility, with the spot price reaching $74.48.
We believe the U3O8 spot price is well supported in holding to higher price levels not seen in over a decade. The World Nuclear Association’s (WNA) biennial Nuclear Fuel Report noted that world nuclear reactor requirements are forecasted to nearly double by 2040, from 171 to 338 MM U3O8e pounds per annum. Understanding of a future demand-supply imbalance is gaining acceptance and is fueling improved sentiment toward uranium.
World nuclear reactor requirements are forecasted to nearly double by 2040.
Uranium demand has been primarily driven by increased utility contracting, which we believe provides strong support and sustainability to higher price levels. These end-user utilities have acquiesced to paying higher uranium prices, which has more impact on pricing than outside financial entities.
Utilities and uranium producers generally contract in the term market, representing uranium sold under long-term, multi-year contracts with deliveries starting a year or more after the agreement is made. These term contracts do not generally only have a fixed price associated with the purchase/sale of uranium. The price for the amount bought/sold may include a fixed price, but more recently, they have a variable price with reference to the market price at the time of delivery. These market reference prices generally have floors and caps that are set at the beginning of the contract. Also, the term contracts may vary in quantities, and utilities have had the option to flex the amount they receive either up or down. Industry media have been reporting the evolution of contracting terms, which includes a reduced number of contracts with flexible quantities, increases in the use of market reference pricing versus fixed pricing, and increases in the prices set at the floors and caps. We believe these contract changes between utilities and uranium producers highlight that we are in a sellers’ market and bolster the case for uranium and uranium miners. Furthermore, it is important to note that nuclear power plants require very large capital investments and that fuel costs related to U3O8 are just 4-8% of their ongoing costs.6 Overall, demand for uranium is inelastic, which means that higher prices are not likely to curtail demand.
Contracts on Pace to Reach Replacement Rate
Thus far in 2023, U3O8 term contracting has already surpassed 2022’s full-year contracting level. 2022 had the highest amount of term contracting in a decade, at 125 MM pounds. 2023’s full-year contracting is on track to be the first year in over a decade to reach the annual replacement rate. Term contracting had been below the replacement rate for the past decade as excess global uranium inventories were drawn down. The era of uranium inventory destocking is behind us as utilities are increasingly focused on the security of supply.
Looking ahead to 2040, utilities have 1.5 billion pounds of cumulative uncovered uranium requirements. As a result, we believe we are still in the early innings of the contracting cycle. Geopolitical risks related to the nuclear fuel supply chain remain heightened. French President Macron’s recent visits to Kazakhstan, Uzbekistan and Mongolia in search of uranium partnerships and investments is a prime example of the strategic importance of securing uranium supplies.
Moving Away from Russian Supply Chains
The nuclear fuel supply chain continues to move away from Russia. Orano SA announced that it will spend $1.8 billion to expand its uranium enrichment plant in France by over 30%.7 Russia accounts for 39% of the global capacity to enrich uranium. Although no sanctions have been levied against Russian services to date, utilities are self-sanctioning by not signing any new contracts with Russian entities. In the U.S., the White House also sent Congress an enrichment request for $2.2 billion in October.8 We believe that forthcoming additional capacity in enrichment (and conversion via ConverDyn) coupled with an industry shift in enrichment from underfeeding to overfeeding may allow utilities to focus more on contracting for future uncovered reactors’ uranium requirements.
Uranium Miners Developments
While the price of physical uranium held firm in October, uranium miners retreated. The broad sector of uranium miners fell by 3.67%,2 while junior uranium miners lost 4.47% on profit taking following several months of outsized gains.3 Nonetheless, the strength in the uranium price has improved the revenue and profit for producers and raised the prospects for further mine restarts and new builds. To this end, there were a couple of positive developments in October.
enCore Energy Corp. (enCore) announced that it had received approval to renew the Radioactive Materials License for its processing plants.9 enCore reaffirmed its plan to resume uranium production at its Rosita plant before the end of November 2023. enCore also plans to restart its Alta Mesa plant in early 2024. These restarts are located in Texas and should help kickstart the revival of U.S. domestic uranium production (see Figure 2). Especially since the U.S.’s domestic uranium production in the first half of 2023 was merely 10,000 pounds of U3O8, relative to annual requirements of approximately 50 million pounds.
Australian uranium miner Boss Energy Ltd. announced its commencement of mining operations at its Honeymoon project10, which has the capacity to produce 2.45 million pounds of U3O8 per year. The project began production in 2011 but was placed on care and maintenance in 2013. This project remains on time and budget for production starting in Q4 2023.
Figure 2. Sources of Uranium for US Nuclear Power Plants 1950 to 2022

Source: EIA. U.S. Energy Information Administration: Monthly Energy Review, Table 8.2, June 2023 Note: data withheld for U.S. power plant purchases from domestic suppliers in 2019 and for domestic production in 2020 to avoid disclosure of individual company data. Included for illustrative purposes only. Past performance is no guarantee of future results.
Regarding new uranium mines, Global Atomic Corporation announced that it finalized its third Letter of Intent (LOI) for the sale of uranium from its Dasa project in Niger. This brings the total contracted volume to 1.5 million pounds of U3O8 per annum over the project's first five years of operations. This may be seen as a vote of confidence in the company given that just a few months ago, the coup d’état in Niger forced Global Atomic to announce delays of 6-12 months in the first production at Dasa to early 2026.11
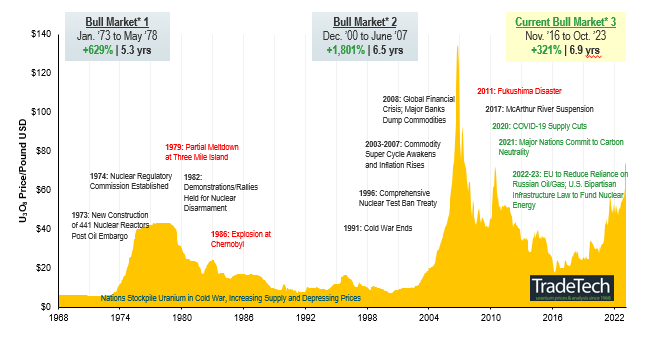
With global uranium mine production well short of the world’s uranium reactor requirements, the supply deficit building over the next decade, a decade of underinvestment in supply, and future supply inhibited by long lead times and capital intensity, we believe that restarts and new mines in development are of critical importance. The uranium price target as an incentive level for further restarts and greenfield development is a moving target, and we believe that we will need higher uranium prices to incentivize enough production to meet forecasted deficits. Over the long term, increased demand in the face of an uncertain uranium supply is likely to continue to support a sustained bull market (Figure 3).
Figure 3. Uranium Bull Market Continues (1968-2023)
Please click here to see an enlarged chart.

Note: A “bull market” refers to a condition of financial markets where prices are generally rising. A “bear market” refers to a condition of financial markets where prices are generally falling. Source: TradeTech Data as of 10/31/2023. TradeTech is the leading independent provider of uranium prices and nuclear fuel market information. The uranium prices in this chart dating back to 1968 is sourced exclusively from TradeTech; visit https://www.uranium.info/. Included for illustrative purposes only. Past performance is no guarantee of future results.
Footnotes
| 1 | The U3O8 uranium spot price is measured by a proprietary composite of U3O8 spot prices from UxC, S&P Platts and Numerco. For periods before July 2021 data is from TradeTech LLC. |
| 2 | The North Shore Global Uranium Mining Index (URNMX) was created by North Shore Indices, Inc. (the “Index Provider”). The Index Provider developed the methodology for determining the securities to be included in the Index and is responsible for the ongoing maintenance of the Index. The Index is calculated by Indxx, LLC, which is not affiliated with the North Shore Global Uranium Miners Fund (“Existing Fund”), ALPS Advisors, Inc. (the “Sub-Adviser”) or Sprott Asset Management LP (the “Adviser”). |
| 3 | The Nasdaq Sprott Junior Uranium Miners™ Index (NSURNJ™) was co-developed by Nasdaq® (the “Index Provider”) and Sprott Asset Management LP (the “Adviser”). The Index Provider and Adviser co-developed the methodology for determining the securities to be included in the Index and the Index Provider is responsible for the ongoing maintenance of the Index. The Adviser will provide certain services in connection with the Index including contributing inputs in connection with the eligibility and proce |
| 4 | The Bloomberg Commodity Index (BCOM) is a broadly diversified commodity price index that tracks prices of futures contracts on physical commodities and is designed to minimize concentration in any one commodity or sector. It currently has 23 commodity futures in six sectors. |
| 5 | The S&P 500 or Standard & Poor's 500 Index is a market-capitalization-weighted index of the 500 largest U.S. publicly traded companies. |
| 6 | Source: Ocean Wall, The Case for Uranium, April 2023. |
| 7 | Source: Bloomberg, 10/20/23. France Plans $1.8 Billion Uranium Plant Expansion to Cut Reliance on Russia. |
| 8 | Source: Nuclear Newswire, 10/26/23. White House backs HALEU enrichment with a request for $2.2 billion |
| 9 | Source: Newswire, 11/06/23. enCore Energy Announces License Renewal for the South Texas ISR Uranium Central Processing Plants (CPP). |
| 10 | Source: ASX Release, 10/11/23. Boss achieves significant milestone with commencement of mining operations on Honeymoon. |
| 11 | Source: Bloomber, 9/08/23. Orano Halts Uranium Treatment in Niger Because of Sanctions on Junta. |
Important Disclosures
An investor should consider the investment objectives, risks, charges, and expenses of each fund carefully before investing. To obtain a fund’s Prospectus, which contains this and other information, contact your financial professional, call 1.888.622.1813 or visit SprottETFs.com. Read the Prospectus carefully before investing.
Exchange Traded Funds (ETFs) are considered to have continuous liquidity because they allow for an individual to trade throughout the day, which may indicate higher transaction costs and result in higher taxes when fund shares are held in a taxable account.
The funds are non-diversified and can invest a greater portion of assets in securities of individual issuers, particularly those in the natural resources and/or precious metals industry, which may experience greater price volatility. Relative to other sectors, natural resources and precious metals investments have higher headline risk and are more sensitive to changes in economic data, political or regulatory events, and underlying commodity price fluctuations. Risks related to extraction, storage and liquidity should also be considered.
Shares are not individually redeemable. Investors buy and sell shares of the funds on a secondary market. Only market makers or “authorized participants” may trade directly with the fund, typically in blocks of 10,000 shares.
The Sprott Active Gold & Silver Miners ETF and the Sprott Silver Miners & Physical Silver ETF are new and have limited operating history.
Sprott Asset Management USA, Inc. is the Investment Adviser to the Sprott ETFs. ALPS Distributors, Inc. is the Distributor for the Sprott ETFs and is a registered broker-dealer and FINRA Member. ALPS Distributors, Inc. is not affiliated with Sprott Asset Management USA, Inc.


