Sprott Critical Materials Monthly
Global Investment Pours into Renewable Energy
- View Critical Materials February 2024 Performance Table
- For the latest standardized performance and holdings of the Sprott Energy Transition ETFs, please visit the individual website pages: SETM, LITP, URNM, URNJ, COPP, COPJ and NIKL. Past performance is no guarantee of future results.
Key Takeaways
- The global commitment to clean energy hit a new milestone in 2023 as investment in energy transition climbed to an unprecedented $1.77 trillion, led by electrified transport.
- Over the past 10 years, investment in global energy transition has grown at a 24% compound annual rate, several times the global GDP (gross domestic product) growth rate.
- Investment in renewables is becoming increasingly diversified, embracing power grids, hydrogen technology, carbon capture and energy storage alongside wind, solar and biofuels projects.
- Clean energy is expected to account for 95% of new utility-scale generating capacity constructed in the U.S. in 2024, versus only 4% for natural gas, firmly marking the arrival of the energy transition.
- The Nasdaq Sprott Energy Transition Materials Index declined modestly in February as uranium prices corrected.
February in Review
The Nasdaq Sprott Energy Transition Materials Index fell 0.76% in February to close the month at 905.60. The uranium complex had its first correction since its September 2023 breakout. Lithium carbonate prices had their first monthly increase since June 2023, helping lithium mining share prices to rally 10.44% from extremely oversold conditions. Nickel prices also posted their first monthly increase since July 2023, but nickel mining shares posted their seventh consecutive down month. Copper commodity and copper mining stocks were off modestly, and both continue to consolidate sideways as long-term copper fundamentals remain buoyant.
As measured by the S&P 500 Index, the broad equity market reached another all-time high in February, led by blowout quarterly earnings from NVIDIA and the continued explosive growth outlook for AI (artificial intelligence). In the U.S., the consumer price index (CPI) and producer price index (PPI) came in higher than expected in February. However, their impact was moderated by a flat reading from the personal consumption expenditure price index (the Federal Reserve’s preferred inflation measure) and other economic data indicating that inflation was not getting ahead of the Fed’s target. In all, expectations remained in place for a soft landing for the U.S. economy, at least three upcoming Fed rate cuts and strong performance by the largest technology stocks, lifting risk assets higher.
Figure 1. Nasdaq Sprott Energy Transition Materials Index Still Consolidating (2019-2024)
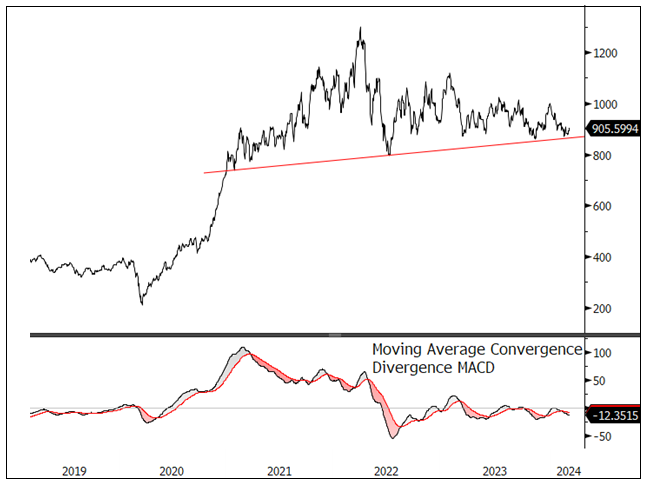
Source: Bloomberg. Nasdaq Sprott Energy Transition Materials Index. Data as of 2/29/2024. Moving average convergence/divergence is a trend-following momentum indicator that shows the relationship between two exponential moving averages (EMAs), calculated by subtracting the 26-period EMA from the 12-period EMA. Included for illustrative purposes only. Past performance is no guarantee of future results.
Updates on Critical Materials
Copper: Fundamentals Get Stronger
The copper spot price fell 1.16% to $3.81 per pound in February (see Figure 2), while shares of copper miners rose by 0.11% and shares of copper juniors fell by 1.06%. The copper markets have been relatively flat year-to-date as macroeconomic headlines have been mixed but fundamentals remain strong.
February saw the release of slightly higher-than-expected U.S. inflation data as measured by the CPI, at 3.1% year-over-year versus the expected 2.9%. As a result, the market pared back its expectations for Fed rate cuts in 2024 to three by the end of the year compared to the six cuts it was expecting last month. Higher rates for longer have traditionally been a headwind for economic growth (and for copper). Still, as growth remains strong in the U.S., the effect of higher rates on the price of copper has been somewhat mitigated. Copper’s diverse demand profile—it's used in everything from consumer electronics to HVAC to construction and more—makes it a bellwether of the global economy.
Investors' expectations for China's economy have also been affecting copper prices. China is the world’s biggest copper consumer and is expected to account for 56% of world consumption in 2024. Economic data from China continues to be weak given the government’s cautious stimulus measures, which are less than what is needed to revive domestic demand meaningfully, revitalize the property market and arrest the deflationary trend.
These headlines from China and the U.S. have affected day-to-day copper prices, but we believe the burgeoning demand from the global energy transition will likely alter the copper market’s fundamental drivers in the future. Energy transition is emerging as a structural tailwind for copper, and as the energy transition sector grows, it is likely to mitigate copper’s sensitivity to overall economic conditions.
Despite mixed economic signals, copper market fundamentals strengthened in February as strong demand from energy transition and supply disruptions resulted in a very tight market. The closure of First Quantum Minerals’ Panama mine, which provided approximately 1.5% of global copper supply, and production cuts (for example, from Anglo American plc) have flipped the 2024 copper market forecast from a small surplus to a deficit. Events like these have tightened copper mine supply and made it difficult to keep up with increasing demand. Codelco, the Chilean state-owned copper miner and the world’s largest copper producer, is a good example. In February, Codelco announced that 2023 production fell by 8.3% versus 2022 and confirmed that this current copper production is the lowest level in 25 years.16
The looming copper supply-demand deficit and the possibility of looser monetary policy support what we believe is a positive outlook that is likely to benefit copper miners ultimately. The current copper shortage has yet to increase the copper price materially, but its effects can still be seen. Bloomberg reported in February that treatment charges to turn copper concentrate into refined metal have plunged to their lowest levels in more than a decade (see Figure 3). Treatment charges are the fees smelters charge miners, and a lower fee means a smaller margin for the smelter and a tighter mine supply.
Figure 2. Copper Trades in a Narrow Band (2019-2024)
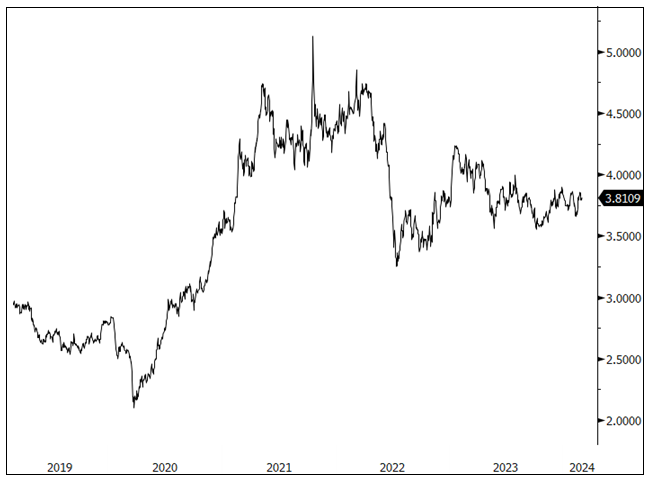
Source: Bloomberg. Copper spot price, $/lb. Data as of 2/29/2024. Included for illustrative purposes only. Past performance is no guarantee of future results.
Figure 3. Copper Treatment Charges Plunge (2013-2024)
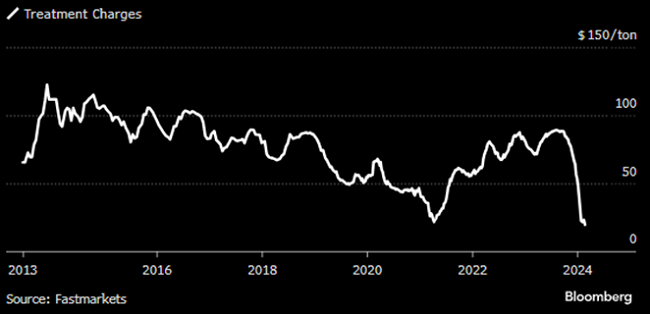
Source: Bloomberg. Data as of 02/24/2024. Included for illustrative purposes only. Past performance is no guarantee of future results.
Lithium: Pickup in Buyer Interest
The lithium carbonate spot price rose 5.99% to $6.40 per pound in February (see Figure 4), and shares of lithium miners rose by 10.44%. Lithium prices have been whipsawing over recent years on inventory destocking amid unsustainably high prices. However, destocking is now easing, and buyer interest has begun to pick up, fueling the recent gains in the lithium markets.
The lithium spot price remains at a relatively low level and continues to intersect with the cost curve, leading some miners to reduce capital expenditure budgets and announce production cuts in high-cost operations. However, these supply curtailments contrast with an expected significant supply-demand deficit in the future. By 2030, lithium demand is expected to be 3.5 times larger than it was in 2023.17 A higher incentive price may be justified because current market prices do not support higher-cost lithium operations.
As the lithium price moved higher in previous years, China turned on the supply of lithium from lepidolite, a lower-grade and higher-cost source. Much of this supply is no longer profitable in the current market environment. In February, China also launched an environmental probe into its top lithium production region, Jiangxi.18 This threatens to further curtail lithium supply in the short term and has supported the recent price rally.
We believe the fundamentals remain intact in the long term, and lithium miners may be well positioned to benefit. Albemarle Corporation, the world’s largest lithium miner, recently called current prices “unsustainable” and noted that prices must rise to meet long-term demand growth.19 Despite the weak current price environment, many lithium miners and other industries remain convinced of the need to produce tomorrow’s lithium. For example, oil and gas behemoth ExxonMobil Corporation affirmed in February that it is expanding into lithium and plans to bring its first lithium project online by 2027.20
Figure 4. Lithium Is Showing Signs of Price Recovery (2019-2024)
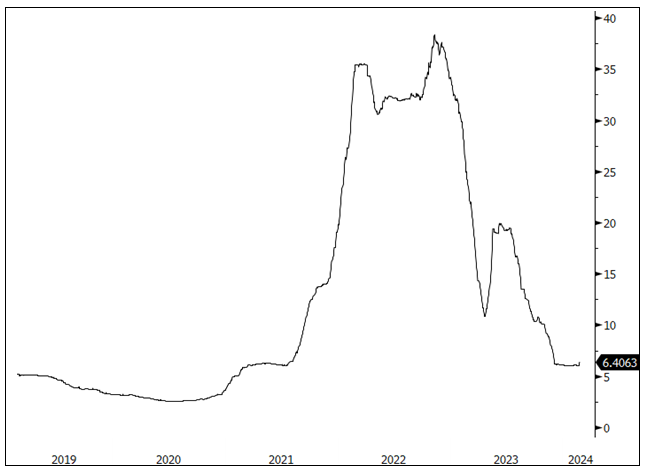
Source: Bloomberg. Lithium carbonate spot price, $/lb. Data as of 2/29/2024. Included for illustrative purposes only. Past performance is no guarantee of future results.
Nickel: Uncertain Supply, Government Support
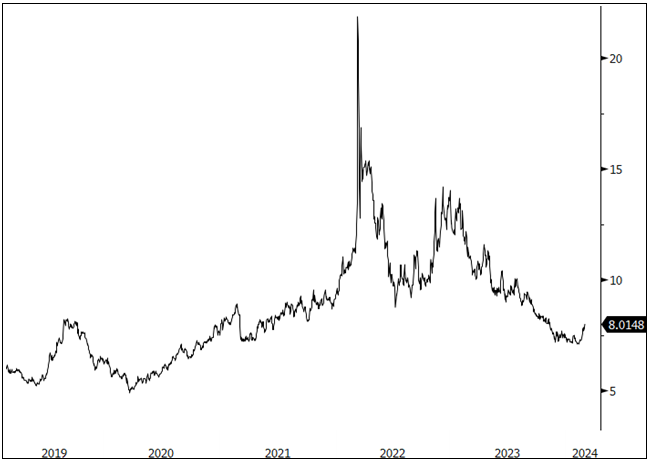
The nickel spot price rose by 10.34% to $8.01 per pound in February (see Figure 5), while shares of nickel miners fell by 6.11%. The nickel spot price rebounded largely due to the Indonesian government's delay in issuing production quotas, known as RKABs (work plan and budget approvals).21 Miners need RKABs to operate in Indonesia, so some Indonesian companies have been forced to halt their nickel mining operations. Consequently, smelters have been forced to rely on inventories, and the uncertainty has bolstered the nickel spot price.
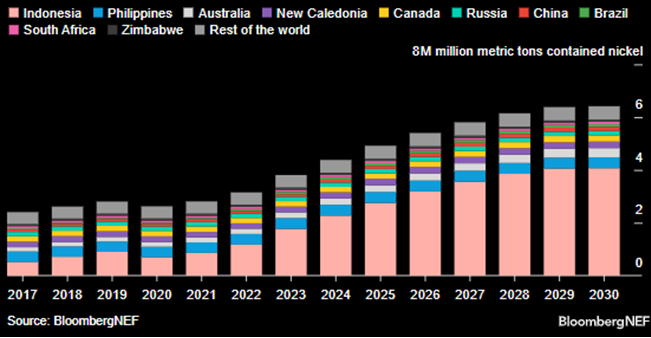
Indonesia is the largest nickel-producing country in the world (see Figure 6), and the rising Indonesian supply has been the main driver of the previous weakness in nickel prices. In 2020, Indonesia’s government banned unprocessed nickel exports and attracted massive Chinese investment into its nickel sector. This and some major technological breakthroughs put the country at the forefront of nickel mining. Notably, Indonesia’s President Joko Widodo, who implemented the country’s resource nationalism, is reaching his maximum term as president. Indonesia held a presidential election in February (which was a factor in delaying the issue of production quotas). The apparent winner of the election, Prabowo Subianto, has publicly supported Widodo’s resource nationalism policies and will likely continue on the same path.22
Elsewhere in the world, higher-cost mines have announced they will suspend operations. In February, BHP reported a $2.5 billion impairment charge for its Australian nickel business.23
Like lithium, nickel’s long-term fundamentals are strong—significant amounts of nickel will be needed in future years to reach net-zero emissions targets. Addressing this short/long dichotomy, Australia classified nickel as a critical mineral in February.24 This designation is more than just symbolic, as it gives Australian miners access to financing under the country’s A$4 billion Critical Minerals Facility, which offers low-interest loans and related grants. The Australian government followed up by announcing its Nickel Financial Assistance Program, which offers a 50% rebate on royalties paid on nickel sales for 18 months when nickel concentrate prices are below $20,000 per metric ton. Like Australia, almost all big economies have listed nickel as a critical mineral.25 Government support and announced nickel mine suspensions may continue to support the nickel price.
Figure 5. Nickel Spot Price USD $/lb (2019-2024)
Source: Bloomberg. Data as of 02/29/2024. Included for illustrative purposes only. Past performance is no guarantee of future results.
Figure 6. Nickel Production by Country
Source: Bloomberg. Data as of 02/04/2024. Included for illustrative purposes only. Past performance is no guarantee of future results.
The Tidal Wave of Investment in Energy Transition
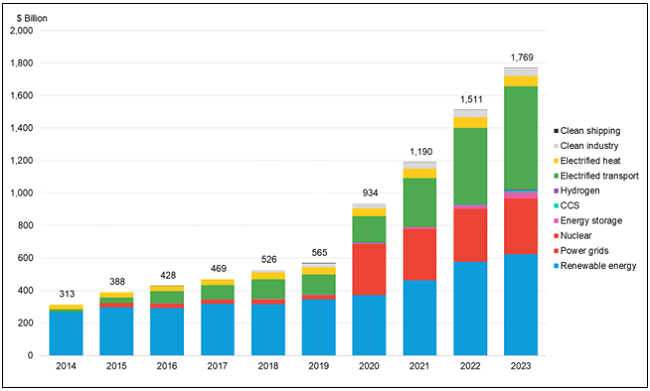
The global commitment to clean energy hit a new milestone in 2023 as investment in energy transition reached an unprecedented $1.77 trillion, 17% higher than the previous year (see Figure 7). It was led by the global shift toward electrified transport, which attracted $634 billion—more than a third of the total. This has emerged as the primary driver of spending on clean technology, pulling ahead of renewable energy ($623 billion in 2023). These investments highlight a transformation in how the world approaches energy consumption and production. Over the past 10 years, investment in global energy transition has grown at a 24% compound annual rate, several times the global GDP growth rate.
Figure 7. Investment by Energy Transition Sector ($ billion)
Source: Bloomberg NEF, Energy Transition Investment Trends 2024. Included for illustrative purposes only. Past performance is no guarantee of future results.
The energy transition landscape is broad and diverse, embracing not just renewable energy projects like wind, solar and biofuels but electric vehicles (EVs), power grids, hydrogen technology, carbon capture and storage (CCS), and energy storage solutions. In short, it entails completely reordering the world's energy system.
BloombergNEF’s report, “Energy Transition Investment Trends 2024,”26 highlights this diversity. It shows a steady 8% annual growth in renewable energy investments overall, led by investment in electrified transport, which is rising at 36% annually.
The developing sectors of hydrogen technology, CCS and energy storage saw an explosive 95% growth in investment in 2023 ($57.8 billion versus $29.7 billion in 2022). Hydrogen investment tripled and CCS investment nearly doubled over their year-ago levels. Elsewhere, investment in the clean energy supply chain (including battery metals and equipment factories) hit a new record at $135 billion in 2023, promising future expansion of the supply chain.
Redefining Energy Transition
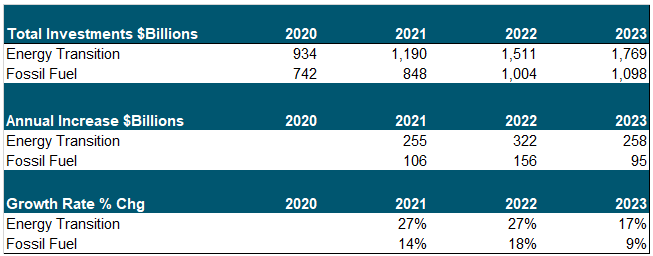
The BloombergNEF report also noted that investment in energy transition technologies (both energy supply and demand) vaulted ahead of investment in fossil-fuel supply (energy supply only) in 2023 by a record $671 billion. This growing gap, up 32% from $508 billion in 2022, underscores the accelerating global preference for sustainable energy sourcing, a trend in place since 2020 (see Figure 8). It includes investment in power grids and other new categories within the energy transition sector, broadening the scope of how the world defines energy transition and creating an increasingly diversified investment flow across different energy transition technologies.
Figure 8. Investment in Energy, New and Old
Source: Bloomberg NEF. Included for illustrative purposes only. Past performance is no guarantee of future results.
Supply-Side Spending: Pluses and Minuses
While the 2023 rise in energy transition investment overall comfortably eclipsed the increase in fossil fuels investment—$258 billion versus $95 billion—there is a critical challenge. Total investment in the supply side of clean energy still lags behind investment in fossil-fuel supply (by $75 billion in 2023). Greater efforts will be needed to transition away from fossil fuels fully.
Between 2020 and 2023, investment in the energy transition sector and the fossil-fuel supply industry increased significantly by $329 billion and $357 billion, respectively (according to BloombergNEF). Together, these represent a massive financing need. Policymakers and investors should note that renewables and fossil fuels compete for this financing.
The rise in energy transition investment is encouraging, but continued substantial investment in fossil fuels indicates how challenging it will be to move away from them. For example, of the total $2.9 trillion invested in the passenger vehicle market in 2023, internal combustion engine vehicles accounted for 81% ($2.35 trillion), dwarfing the $543 billion (19%) spent on electric and fuel-cell vehicles. At the same time, the trend is in the right direction. The 19% share of investment for electric and fuel-cell vehicles in 2023 was substantially higher than the 5% allocated to them in 2020 and equates to a 63% annualized growth rate in investment versus 2.35% for ICE vehicles (according to BloombergNEF).
More Is Needed for Net Zero
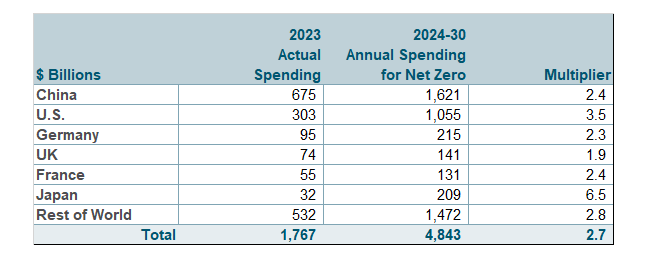
Despite record-setting growth in renewable energy installations, the journey toward a sustainable future is far from complete. To achieve the ambitious goals of the Paris Agreement, BloombergNEF's Net Zero Scenario suggests that global investment in energy transition technologies will need to nearly triple to an average of $4.84 trillion per year from 2024 to 2030 (see Figure 9). This scenario emphasizes the critical role of electrified transport and renewable energy in the global energy transition. It shows that major economies are still off track in meeting their net-zero commitments, and investment levels will need to rise sharply.
The transition to clean energy is not just about addressing climate change; it's about reordering the global energy landscape to reflect that sustainability, energy security and national security are deeply intertwined. The record investments in 2023 signify a powerful wave of change, but there is still a long way to go.
Figure 9. Net-Zero Spending Gaps
Source: Bloomberg NEF. Data as of 12/31/2023. Included for illustrative purposes only. Past performance is no guarantee of future results.
Renewables Power Onward
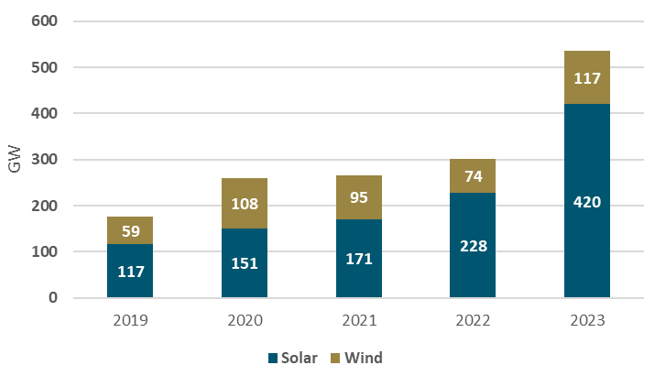
As sustainability and green energy become the focus of global energy policies, the renewable energy sector has set a new benchmark. Last year it saw its most rapid expansion in over two decades as renewable energy installations climbed 78%, solidifying the world's accelerating shift toward more sustainable sources (see Figure 10).
Figure 10. Harnessing the Sun and Wind
Source: International Energy Agency, Clean Energy Market Monitor, March 2024.
In 2023, an estimated 537 gigawatts of renewable electricity capacity was added to the global energy grid. It was the largest annual increase in over 20 years. Solar energy is leading the charge. Last year alone the world installed 420 gigawatts of solar power, accounting for about three-quarters of all new renewable energy installations. Solar power’s dominance, spanning both utility-scale projects and rooftop installations, highlights its pivotal role in the ongoing energy transition, as noted in the International Energy Agency (IEA)’s Clean Energy Market Monitor, March 2024.27
The Clean Energy Era Takes Shape
The landscape of the U.S. power sector is undergoing a transformative shift toward clean energy. Renewables, batteries and nuclear power are poised to dominate capacity additions in 2024. The EIA expects these clean energy sources to account for 95% of all new power capacity constructed this year, underscoring the shift from traditional to sustainable sources.
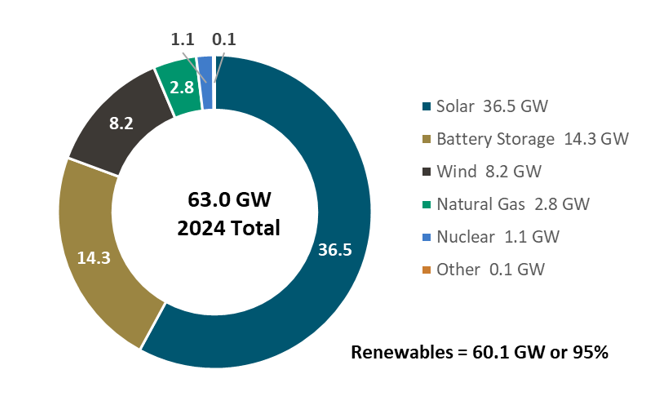
According to the EIA, total power plant construction in the U.S. is expected to increase in 2024 with a capacity addition of 63.0 gigawatts—the biggest annual increase since 2003. However, it is the composition of these additions that highlights the clean energy revolution that is taking place.28
Solar energy is expected to represent 58% of new utility-scale generating capacity (see Figure 11). Battery storage is second (somewhat surprisingly) and is expected to add 23% of new capacity. Wind energy should contribute a further 13%, while completing the final nuclear reactor at Vogtle in Georgia would add 2% of new capacity. In stark contrast, natural gas, once a cornerstone of U.S. electricity production, is relegated to a mere 4% of planned new capacity.
Figure 11. Renewables Dominate Electricity Additions
Planned Utility-Scale Electric Capacity Additions in 2024
Source: U.S. Energy Information Administration, Preliminary Monthly Electric Generator Inventory, December 2023.
This dramatic shift is underpinned by the plummeting costs of renewables and battery storage, a trend driven by mass manufacturing and the growing expertise of developers in delivering these projects cost-effectively. The U.S. 2022 Inflation Reduction Act, with its range of tax incentives for clean energy installations, has accelerated momentum.
The investment plans of power providers and developers show that carbon-free energy has become the most competitive option for future power needs and is reshaping the energy landscape. Last year set a precedent for large-scale solar construction, and 2024 is on track to surpass that achievement. Similarly, battery installations are expected to reach 14.3 gigawatts in 2024, nearly double the overall installed grid battery capacity in the U.S., a significant portion of which supports the solar markets in Texas and California.
By comparison, natural gas-fired plants are expected to add only 2.8 gigawatts in capacity in 2024, illustrating the diminishing role of fossil fuels in electricity generation. Natural gas and coal remain a significant portion of the United States' installed electricity generation capacity but are steadily being displaced by less costly renewables. The near-total dominance of clean energy in planned power plant construction in 2024 sends a clear message that the renewable energy era has firmly arrived.
Critical Materials: February 29, 2024 Performance
| Metric | 2/29/24 | 1/31/24 | Change | % Chg | YTD Chg | Monthly Comment |
| Miners | ||||||
| Nasdaq Sprott Energy Transition Materials™ Index1 | 905.60 | 912.56 | (6.96) | (0.76)% | (8.15)% |
It was a mixed month for the energy transition space as uranium had its first correction since the September price breakout. Lithium had a bounce from extremely oversold levels, while copper and nickel miners continued to be dragged down by the poor economic data from China. |
| Nasdaq Sprott Lithium Miners™ Index2 | 600.76 | 543.98 | 56.78 | 10.44% | (18.43)% | |
| North Shore Global Uranium Mining Index3 | 3,877.09 | 4,340.95 | (463.86) | (10.69)% | 0.80% | |
| Nasdaq Copper Miners Index4 | 1,031.56 | 1,030.40 | 1.16 | 0.11% | (1.41)% | |
| Nasdaq Sprott Nickel Miners™ Index5 | 579.36 | 617.09 | (37.73) | (6.11)% | (12.35)% | |
| Nasdaq Sprott Junior Copper Miners™ Index6 | 921.82 | 931.68 | (9.87) | (1.06)% | (4.71)% | |
| Nasdaq Sprott Junior Uranium Miners™ Index7 | 1,531.34 | 1,728.96 | (197.62) | (11.43)% | 5.26% | |
| Physical Materials | ||||||
| Lithium Carbonate Spot Price $/lb8 | 6.40 | 6.04 | 0.36 | 5.99% | 3.90% |
First monthly increase since June 2023. |
| U3O8 Uranium Spot Price $/lb9 | 94.60 | 101.08 | (6.48) | (6.41)% | 3.85% |
This is the first correction since the September breakout. |
| LME Copper Spot Price $/lb10 | 3.81 | 3.86 | (0.04) | (1.16)% | (0.74)% |
Holding ground on strong fundamentals. |
| LME Nickel Spot Price $/lb11 | 8.01 | 7.26 | 0.75 | 10.34% | 7.91% |
First monthly increase since July 2023. |
| Benchmarks | ||||||
| S&P 500 Index12 | 5,096.27 | 4,845.65 | 250.62 | 5.17% | 6.84% |
The broad market made new all-time highs as mega-cap tech stocks, especially NVIDIA, powered higher, beating and raising expectations. Higher-than-expected CPI and PPI were ameliorated by an in-line PCE. |
| DXY US Dollar Index13 | 104.16 | 103.27 | 0.88 | 0.85% | 2.79% | |
| BBG Commodity Index14 | 96.70 | 98.56 | (1.86) | (1.89)% | -1.97% | |
| S&P Metals & Mining Index15 | 2,892.04 | 2,927.81 | (35.77) | (1.22)% | (5.60)% | |
*Mo % Chg and YTD % Chg for this Index are calculated as the difference between the month end's yield and the previous period end's yield, instead of the percentage change. BPS stands for basis points. Past performance is no guarantee of future results.
| 1 | The Nasdaq Sprott Energy Transition Materials™ Index (NSETM™) is designed to track the performance of a selection of global securities in the energy transition materials industry, and was co-developed by Nasdaq® and Sprott Asset Management LP. |
| 2 | The Nasdaq Sprott Lithium Miners™ Index (NSLITP™) is designed to track the performance of a selection of global securities in the lithium industry, including lithium producers, developers and explorers; the Index was co-developed by Nasdaq® and Sprott Asset Management LP. |
| 3 | The North Shore Global Uranium Mining Index (URNMX) is designed to track the performance of companies that devote at least 50% of their assets to the uranium mining industry, which may include mining, exploration, development and production of uranium, or holding physical uranium, owning uranium royalties or engaging in other non-mining activities that support the uranium mining industry. |
| 4 | The Solactive Global Copper Miners Index includes international companies active in exploration, mining and/or refining of copper. The index includes a minimum of 20 and a maximum of 40 members. The calculation is done in USD as a total return index. Index adjustments are carried out semi-annually. |
| 5 | Nasdaq Sprott Nickel Miners™ Index (NSNIKL™) is designed to track the performance of a selection of global securities in the nickel industry. |
| 6 | Nasdaq Sprott Junior Copper Miners™ Index (NSCOPJ™) is designed to track the performance of mid-, small- and micro-cap companies in copper-mining related businesses. |
| 7 | Nasdaq Sprott Junior Uranium Miners™ Index (NSURNJ™) is designed to track the performance of mid-, small- and micro-cap companies in uranium-mining related businesses. |
| 8 | The lithium carbonate spot price is measured by the China Lithium Carbonate 99.5% DEL. Source Bloomberg and Asian Metal Inc. Ticker L4CNMJGO AMTL Index. Data converted to pounds and to USD with Bloomberg FX Rates. |
| 9 | The U3O8 uranium spot price is measured by a proprietary composite of U3O8 spot prices from UxC, S&P Platts and Numerco. |
| 10 | The copper spot price is measured by the LME Copper Cash ($). Source Bloomberg ticker LMCADY. Data converted to pounds. |
| 11 | The nickel spot price is measured by the LME Nickel Cash ($). Source Bloomberg ticker LMNIDY. Data converted to pounds. |
| 12 | The S&P 500 or Standard & Poor's 500 Total Return Index is a market-capitalization-weighted index of the 500 largest U.S. publicly traded companies. |
| 13 | The U.S. Dollar Index (USDX, DXY) is an index of the value of the U.S. dollar relative to a basket of foreign currencies. |
| 14 | The Bloomberg Commodity Index (BCOM) is a broadly diversified commodity price index that tracks prices of futures contracts on physical commodities, and is designed to minimize concentration in any one commodity or sector. It currently has 23 commodity futures in six sectors. |
| 15 | The S&P Metals & Mining Select Industry Index comprises stocks in the S&P Total Market Index that are classified in the GICS metals & mining sub-industry. |
| 16 | Reuters, “Chile copper miner Codelco's production falls 8.3% in 2023 – Cochilco”, February 12, 2024. |
| 17 | BloombergNEF, “Transition Metals Outlook 2023”, January 18, 2023. |
| 18 | Time, “An Environmental Probe Into China’s Top Lithium Hub Threatens Global Supply”, February 27, 2023. |
| 19 | BNN Bloomberg, “Top Lithium Supplier Albemarle Says Prices Are Unsustainably Low”, February 15, 2024. |
| 20 | Bloomberg, “Exxon Plows Ahead with Foray into Lithium Despite Slump”, February 16, 2024. |
| 21 | Reuters, “Tighter Indonesian nickel ore supply boosts prices, curbs smelter output”, February 28, 2024. |
| 22 | Financial Review, “Presumed president Prabowo to plough ahead on nickel”, February 15, 2024. |
| 23 | Mining.com. “ BHP says nickel faces “difficult multi-year run”, February 19, 2024. |
| 24 | Reuters, “Australia lists nickel as 'critical mineral' to unlock billions in support”, February 16. |
| 25 | BloombergNEF. Available through paid service only. |
| 26 | BloombergNEF, “Energy Transition Investment Trends 2024”. |
| 27 | IEA, “Clean Energy Market Monitor – March 2024”. |
| 28 | EIA, “Electricity Monthly Update”, February 27, 2023. |
Important Disclosures
An investor should consider the investment objectives, risks, charges, and expenses of each fund carefully before investing. To obtain a fund’s Prospectus, which contains this and other information, contact your financial professional, call 1.888.622.1813 or visit SprottETFs.com. Read the Prospectus carefully before investing.
Exchange Traded Funds (ETFs) are considered to have continuous liquidity because they allow for an individual to trade throughout the day, which may indicate higher transaction costs and result in higher taxes when fund shares are held in a taxable account.
The funds are non-diversified and can invest a greater portion of assets in securities of individual issuers, particularly those in the natural resources and/or precious metals industry, which may experience greater price volatility. Relative to other sectors, natural resources and precious metals investments have higher headline risk and are more sensitive to changes in economic data, political or regulatory events, and underlying commodity price fluctuations. Risks related to extraction, storage and liquidity should also be considered.
Shares are not individually redeemable. Investors buy and sell shares of the funds on a secondary market. Only market makers or “authorized participants” may trade directly with the fund, typically in blocks of 10,000 shares.
The Sprott Active Gold & Silver Miners ETF and the Sprott Silver Miners & Physical Silver ETF are new and have limited operating history.
Sprott Asset Management USA, Inc. is the Investment Adviser to the Sprott ETFs. ALPS Distributors, Inc. is the Distributor for the Sprott ETFs and is a registered broker-dealer and FINRA Member. ALPS Distributors, Inc. is not affiliated with Sprott Asset Management USA, Inc.


