Special Report
Top 10 Themes for 2024
View Critical Materials 2023 Performance Table
What forces are likely to drive energy transition materials and precious metals markets in 2024 and over the next decade? We discuss 10 critical macroeconomic and market-specific themes ranging from deglobalization and climate policy to the new commodity supercycle and a looming silver price breakout.
Global Macroeconomic Changes
#1. De-Globalization Marches On
#2. Energy Security Becomes More Critical
#3. A New Commodity Supercycle Emerges
#4. Climate Policy Drives Investment
#5. Left and Right Tail Market Catalysts
Energy Transition Materials
#6. Uranium Rides a Structural Deficit
#7. Copper’s Supply-Demand Imbalance Worsens
#8. Turbulent Lithium Market Benefits Miners
Precious Metals
#9. Gold May Be Poised to Go Higher
Global Macroeconomic Changes
#1. Deglobalization Marches On
Deglobalization — the process of reversing or reducing the interdependence of the world economy — continues. Global trade fell 5% in 2023, and expectations for 2024 are pessimistic.16 Since 2020, deglobalization has been spurred by several developments. The COVID-19 pandemic disrupted global supply chains and highlighted their vulnerability, increasing protectionism and nationalism. The Russia-Ukraine war raised geopolitical tensions between Russia and the West, exposed Europe's energy dependence on Russia, and triggered sanctions and countersanctions on trade and investment. The trade war between the United States and China, which started in 2018 and has intensified, produced higher tariffs, export restrictions, and efforts to decouple in strategic sectors like technology, finance and defense.
The drive to energy transition, which aims to achieve net-zero emissions by 2050, requires radically transforming the world economy — its energy systems, industrial production and consumption patterns. Economic and policy dynamics are increasingly playing a part, and geopolitical divisions will make this more challenging, especially as national security concerns take precedence. Policy developments in North America, Europe and Australia are reshaping supply chains, especially in battery technology and the sourcing of critical minerals.
The return of great power rivalry, particularly between the U.S. and China, is also helping to change supply chains and reinvigorate industrial policy. It has also created vulnerabilities to supply shocks, such as potential restrictions on China's export of clean energy technologies and critical minerals. Russia's invasion of Ukraine and the global pandemic prompted many countries to domesticate and diversify their supply chains. While this can increase resilience, it also leads to more segmented energy markets and fewer options during supply disruptions.
#2. Energy Security Becomes More Critical
Once considered an outdated concept, energy security — having available and sufficient energy at affordable prices — has re-emerged as a critical issue. It is no longer only about availability and affordability but also managing new and more complex risks, e.g., how to diversify and integrate different energy sources, create resilience to shocks and changes, and promote transparency in energy markets and policies. Significant events in the past few years have shown how energy transition and geopolitics are intertwined.
The new energy insecurity is driven by three main factors: deglobalization and the resurgence of great power rivalry (particularly between the U.S. and China), efforts to reshore and diversify supply chains, and the harsh realities of climate change. The energy-geopolitical landscape is changing, with traditional energy heavyweights (Saudi Arabia and Gulf oil producers) recalibrating their oil flows to the East, and other (mainly Western) countries striving for more domestic renewable energy sources and diversified supply chains. These changes and OPEC's strengthening ties with China and Russia have increased energy security risks, leading to more segmented energy markets and greater vulnerabilities.
An interconnected global energy system remains crucial for energy security, as markets are most efficient when energy supplies can be properly allocated. Isolated regional energy systems are more vulnerable to global-scale disruptions. In this new geopolitical era, the drive for domestication and diversification has increased the complexities of energy security. A secure energy system must be resilient and capable of withstanding unexpected shocks and disruptions. It requires reliable energy infrastructure, flexibility in the energy system, and the ability to manage demand effectively. Nuclear power, along with solar and wind power (balanced with adequate storage capacity), are excellent examples of systems that meet these criteria.
#3. A New Commodity Supercycle Emerges
As the global energy transformation advances, a new commodity supercycle is emerging. It is driven by the transition to renewable energy taking shape worldwide. This paradigm shift contrasts sharply with the previous supercycle, which was mainly fueled by China's rapid industrialization and urbanization.
This commodity supercycle is being driven by the transition to renewable energy taking shape worldwide.
The current trend is not just a shift in energy sources; it represents a comprehensive overhaul of infrastructure, policy and market dynamics on a global scale (including China). This goes well beyond merely scaling up solar, wind and storage technologies. It requires comprehensively upgrading and expanding the transmission grid to manage the growing influx of renewable resources in order to maximize flexibility and resiliency. The shift to renewable energy is not only global in scale but also a multigenerational endeavor.
Copper, a mature, well-developed industrial metal crucial for electric vehicle (EV) transportation and electrical infrastructure, is set to see substantial demand growth. Since joining the World Trade Organization in 2000, China is estimated to have consumed roughly 90 million tonnes of copper in a little over 20 years.17 However, the International Energy Agency projects total copper consumption for energy transition over the next two decades could be between 180 million and 320 million tonnes, depending on how closely countries approach net-zero emissions targets (see Figure 1). This means that, depending on the policy path, copper consumption for energy transition over the next two decades could be two to four times the amount of copper China has consumed since 2000.
Figure 1. Two Paths for Energy Transition’s Copper Consumption (2022-2042E)
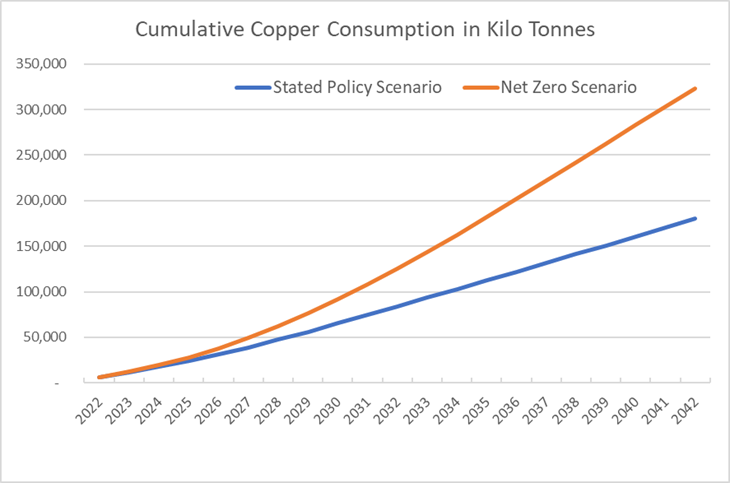
Source: International Energy Agency, “Critical Minerals Market Review 2023.” Cumulative copper consumption for the energy transition in kilo tonnes. Included for illustrative purposes only. Past performance is no guarantee of future results.
A notable strategic realignment is occurring as Western nations pivot from trade with China and adopt more protectionist policies. Recent policies in these countries have focused on reshaping the battery supply chain, reducing reliance on Chinese materials, and promoting near- and friend-shoring strategies. In the early 2000s, metal markets were entirely globally accessible. However, the metals markets of the coming energy transition will likely see more constrained availability through restricted trade access and resource nationalism or limited mine supply. Duplication and regionalization of metals markets is entirely possible.
#4. Climate Policy Drives Investment
Climate policy will continue to be of paramount importance to metals and mining industries due to their key role in the global energy transition. Critical minerals are essential to decarbonizing energy generation, transmission and storage systems. However, efforts will need to accelerate to meet ambitious climate goals.
The pressure to transition to cleaner energy sources is set to intensify and will demand a significant increase in investments. Notably, 2022 marked a crucial milestone as investments in energy transition equaled those in fossil fuels for the first time (see Figure 2). However, as projections from Bloomberg New Energy Finance (BNEF) indicate, it could be necessary to quadruple this ratio on average throughout the 2020s.18 There is an urgent need to implement policies that can catalyze transformative changes and propel adoption rates of sustainable practices up the S-curve.
At COP28, nations pledged to triple global renewable energy capacity by 2030 and transition away from fossil fuels.
The agreement reached at COP28 (2023 United Nations Climate Change Conference or Conference of the Parties of the UNFCCC) in December 2023 underscored the world’s commitment to combat climate change. Nations pledged to triple global renewable energy capacity by 2030 and transition away from fossil fuels. This landmark commitment not only aligns with climate goals but holds significant implications for critical minerals like lithium, for which there is no alternative in EV batteries. Copper, another essential metal, is expected to experience a surge in demand, driven by the commitment to triple renewable capacities. Citigroup, for example, forecasts a 4.2-million-tonne increase in copper demand by 2030, with prices anticipated to rise to $15,000 per tonne in the next two years, compared to $8,464 per tonne at the end of 2023.19
The global push for cleaner energy extends to nuclear power as well, with 22 countries pledging to triple global nuclear energy capacity by 2050. This signals a significant uptick in long-term demand for uranium — one more example of the broad spectrum of metals and minerals that will be needed for diversified, sustainable and low-carbon energy systems.
Figure 2. Accelerating Global Investment in Energy Transition (2004-2020)
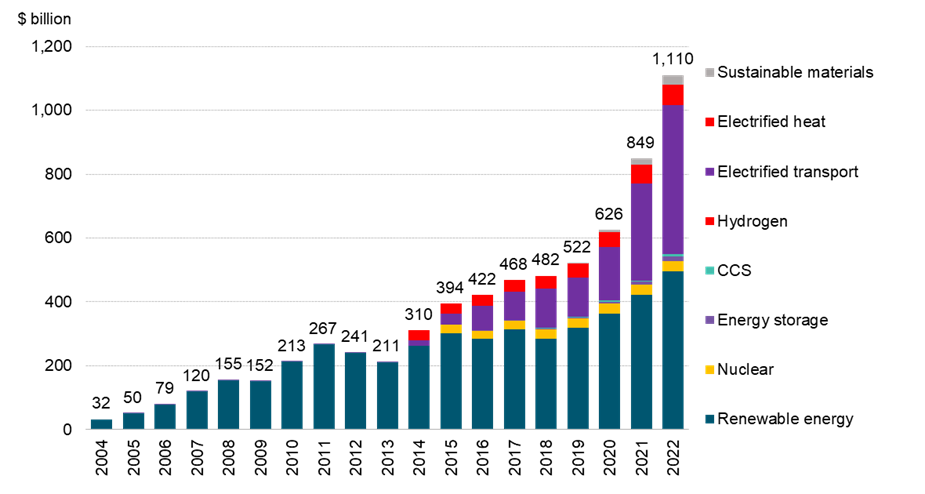
Source: BloombergNEF, “Energy Transition Investment Trends 2023”. Included for illustrative purposes only. Past performance is no guarantee of future results.
#5. Left and Right Tail Market Catalysts
Global metal consumption is forecasted to rise in 2024, fueled by the burgeoning renewable energy sector and the EV market. This "green boom" is expected to offset sluggishness in more traditional industries. However, the market faces a mix of short-term challenges and opportunities. As demand rises, increased supply could lead to modest surpluses in several base metals. At the same time, geopolitical factors like mining disruptions and resource nationalism could occur more often and undermine these surpluses quickly. There is also scope for further weakness in the U.S. dollar, which could lift commodity prices (see #9 Gold Poised to Go Higher).
Geopolitical tensions appear set to rise, especially with a slew of critical elections in 2024 (over 60 countries and more than half of the world's population will be going to the polls). Politics are a double-edged sword in energy transition. On the one hand, government support and international cooperation are key to setting ambitious net-zero targets and providing the needed regulatory framework. On the other hand, political instability, legislative inconsistency and the rise of populism threaten to derail progress. The global energy transition will continue to evolve, offering immense opportunities for transformation and growth, but the global political landscape in 2024 will somewhat determine its pace.
At the same time, with well-known and large-scale risks like escalating Middle East tensions, the Russia-Ukraine war, China's property market crisis and tensions with Taiwan, and the U.S. national election, the safe haven attributes of precious metals may become more attractive.
Energy Transition Materials
#6. Uranium Rides a Structural Deficit
2023 was a blockbuster year for uranium and uranium miners. The U3O8 spot price gained 88.54% to end the year at $91.09/lb. Uranium demand has been primarily driven by an increase in utility contracting to replacement rate. This should provide strong support for higher price levels. The long-term fundamentals for uranium are bullish, and price momentum is likely to continue into 2024. Note that despite the recent surge, uranium is still short of its all-time high of $135/lb. reached in 2007.
Sentiment around nuclear energy is undeniably brightening, underscored by the optimism seen at COP28. Nations have increasingly come to realize the need for reliable baseload power to offset the intermittent nature of renewables. Nuclear energy is uniquely positioned to deliver this and provide energy security without compromising on emissions. This positive momentum is shaping robust international collaboration with 22 countries pledging to triple nuclear capacity by 2050. It is also fueling ambitious plans for new reactor builds, extensions and restarts.20 As these gain traction, uranium and uranium miners may be the ultimate beneficiaries, especially in light of the fundamental supply-demand deficit in the market.
22 countries have pledged to triple nuclear capacity by 2050.
Increasing geopolitical instability will continue to be a major driver in the uranium markets. With the Russian invasion of Ukraine, prices of uranium conversion and enrichment services surged in 2022 as utilities focused on the markets in which Russia had an outsized impact. However, in 2023 these price increases cascaded down to the uranium spot price as utilities were able to shift their focus. In 2024 we expect utilities to continue to self-sanction and refrain from signing new contracts with Russian entities, perhaps accompanied by government legislation. The U.S. House of Representatives passed the Prohibiting Russian Uranium Imports Act in 2023, and it now awaits consideration in the Senate. The 2023 coup in Niger and Kazakhstan’s chronic inability to meet production guidance add to the uncertainty and underscore the importance of supply security.
With uranium mine supply persistently below the needs of the world’s uranium reactors, the market has relied on secondary supplies. However, we believe that the era of inventory destocking, the primary source of secondary supplies, is over. We expect an industry shift from underfeeding to overfeeding will move enrichment processes from creating additional supplies of uranium to instead creating additional demand. The uranium market is forecast to face a growing supply-demand deficit (see Figure 3) that could ultimately benefit uranium and uranium miners.
Figure 3. Uranium Supply More Uncertain Than Ever (2008-2040E)
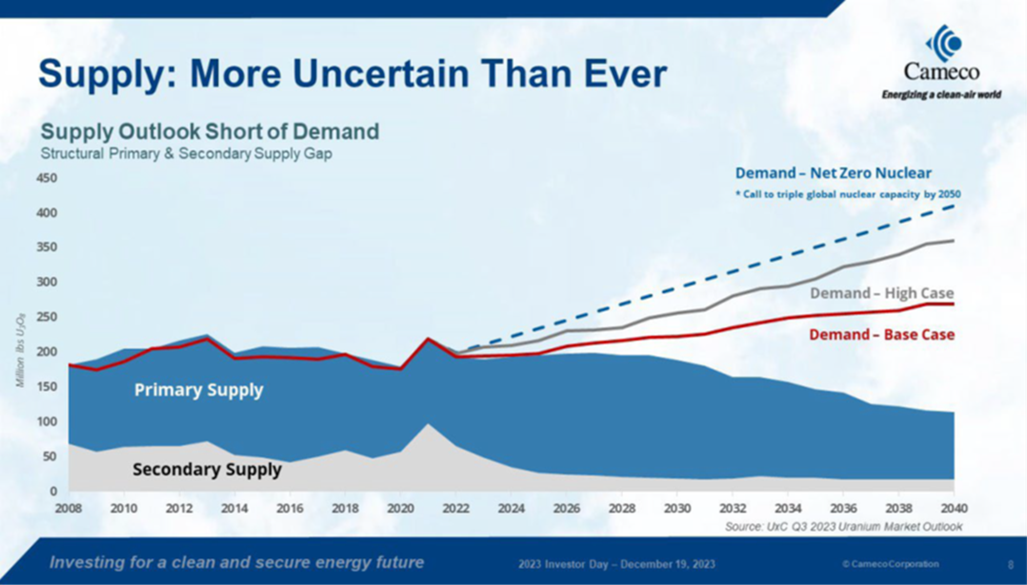
Source: Cameco. Data as of December 2023. Included for illustrative purposes only. Past performance is no guarantee of future results.
#7. Copper’s Supply-Demand Imbalance Worsens
The copper market fluctuated throughout 2023 but ultimately maintained its value and closed the year up 1.19% at $3.84/lb. Despite economic challenges, copper demonstrated remarkable resilience compared to other commodities like lithium and nickel.
Economic factors, such as China’s weaker-than-expected performance in 2023 and rising interest rates, have traditionally had significant impacts on the copper price. However, these effects have been mitigated by the growing need for copper in the energy transition sector. Demands from the electricity grid, EVs and renewable energy deployments have become the primary growth drivers for the copper market and have diversified copper away from solely being a barometer of the global economy. We expect this process to accelerate in 2024 as the previous commodity supercycle, led by the industrialization and urbanization of China, gives way to the energy transition-led commodity supercycle.
However, the robust outlook for growth in copper demand contrasts starkly with the supply side. Supply challenges stem from slower-than-expected new builds and capacity expansions coupled with the depletion of copper reserves from aging assets. Latin America, the largest copper-producing region globally, particularly grapples with acute supply pressures. Notably, despite plans for increased production, Codelco, the largest copper miner in the world, is experiencing its lowest production levels in 25 years. This predicament is exacerbated by the simultaneous global decline in ore grades, intensifying the supply challenges.
There is a minimal buffer in copper inventories that heightens the risk of sudden price surges.
To add to these difficulties, disruptions in copper supply have been on the rise. These disruptions historically hovered around 5% of supply, but the ratio has risen with recent events. Most notable was the shutdown of a significant mine in Panama which alone accounted for 1.5% of the global copper mine supply. Elsewhere, operational issues have led Anglo American to curtail its copper production. Collectively, these disruptions have tilted the copper market from a projected slight surplus to an impending deficit for the year 2024. The combination of production struggles, declining ore quality and unexpected shutdowns underscores the vulnerability of the copper supply chain.
The looming copper supply-demand deficit (see Figure 4) coincides with notably low inventories. There is a minimal buffer in inventories that heightens the risk of a sudden price surge should buyers make large drawdowns to secure supplies. The possibility of more accommodative macroeconomic policy in 2024 further fuels the outlook for copper and creates price opportunities for copper miners. There is also the potential for mergers and acquisitions in the industry as many large miners prioritize copper as a strategic metal, adding an additional layer of optimism for existing copper miners.
Figure 4. Copper Supply Fails to Keep Up with Demand (2022E-2050E)
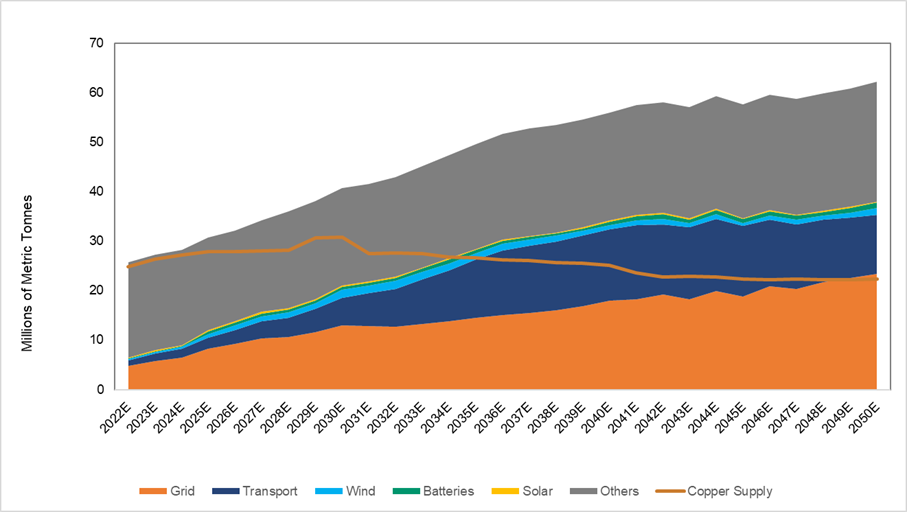
Source: BloombergNEF, “Transition Metals Outlook 2023”. Included for illustrative purposes only. Past performance is no guarantee of future results
#8. Turbulent Lithium Market Benefits Miners
The lithium spot price fell sharply in 2023, ending the year down 81.95% at $6.16/lb. This contrasted with lithium miner stock prices, which saw a smaller decline of 20.15%. The lithium spot price has been extremely volatile as it descended from unsustainable highs in 2022, but by the end of 2023, it was still 2.4 times higher than its 2020 low (see Figure 5). Inventory destocking and lower-than-expected EV sales drove down this immature market. Crucially, the EV slowdown was not an outright decline but a deceleration in strong growth. Global EV sales in 2023 are estimated to be 14 million (up 40% from 2022), and 2024 sales are forecasted at 18 million (up an additional 29%).
The precipitous decline in the lithium spot price halted in December 2023 as the price intersected further into the cost curve. The current price now poses a threat to higher-cost projects under development and to the supply of higher-cost, low-grade lithium (lepidolite) from China. In 2024, both supply and demand are forecasted to increase significantly. As the decade progresses, the long-term fundamentals will likely remain intact, given the challenge of meeting the ambitious demand requirements of net-zero by 2050.
Lithium miners are likely poised to benefit, especially as deglobalization spurs reshoring and friend-shoring. Both China and the West need to invest in their supply chains to secure future supply. For example, the U.S. Inflation Reduction Act of 2022 incentivizes the production of lithium in North America and friend-shoring with tax incentives and investment funding. Weakened lithium prices could propel robust mergers and acquisitions activity to continue into 2024. The likelihood of a restrained rise in the spot price and the prospect of lower interest rates could also bolster this capital-intensive sector.
Figure 5. Weaker Lithium Bullish for Miners (2019-2023)
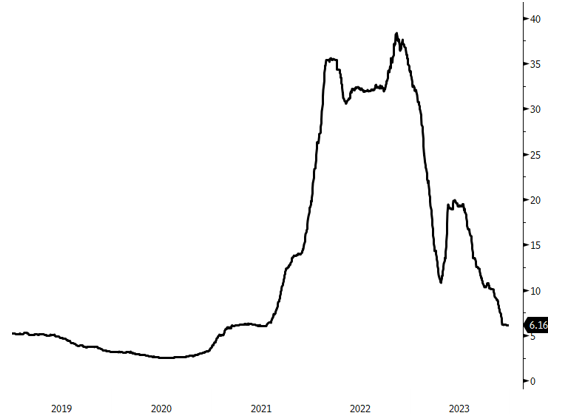
Source: Bloomberg. Lithium carbonate spot price, $/lb, 2018-2023. Data as of 1/5/2024. Included for illustrative purposes only. Past performance is no guarantee of future results.
Precious Metals
#9. Gold May Be Poised To Go Higher
Despite the Federal Reserve's (Fed) aggressive tightening in 2023, the gold price finally made an all-time high after touching the $2,000 mark multiple times. Aggressive buying from central banks and sovereigns overcame the negative impact of high real interest rates and a strong U.S. dollar. Gold's resilience continued even as speculative investors moved away from long positions and ETF liquidations continued. The Federal Funds rate is expected to peak at about 5.50% with a dovish pivot around mid-2024. In 2024, a less hawkish Fed stance could bolster gold prices and — in anticipation of this shift — prompt further short covering and new long CFTC and ETF positions in gold.21
Central bank buying and investor hedging against potential policy shifts and economic uncertainties are likely to drive robust gold demand.
A less restrictive Fed policy would reduce carry costs and benefit discretionary traders (as reflected in CFTC and ETF data). At the same time, any premature rate cuts by the Fed before it reaches its inflation target could raise questions about the Fed's rate path and future inflation, which could provide upside for gold prices. Most importantly, the Fed may cut rates even before it hits its 2% inflation target as insurance against "passive tightening" in the face of moderating inflation and softer labor data. As Fed Governor Christopher Waller intimated, the Fed may cut rates to maintain the real policy rate's effectiveness, even if the economy is not in recession. That could directly lead to a lower U.S. dollar and lower real rates. Meanwhile, the U.S. government securities liquidity index22 remains highly elevated, which implies that there will be further efforts to weaken the U.S. dollar in 2024 (see our December commentary, Gold’s Bold Move to New Closing High, for more details about the interaction of the dollar and Treasury liquidity).
The official sector's gold buying trends since Q2 2022 underscore the strength of demand. Central bank quarterly purchases have averaged 328 tonnes over the past five quarters, a 2.6-times increase from the prior decade's quarterly average of 127 tonnes per quarter. Efforts by many countries (for example, China) to move away from U.S. dollar-based reserve assets will only strengthen as deglobalization and geopolitical stresses increase. A 2023 World Gold Council survey found that 24% of central banks planned to increase their gold reserves and view gold as a vital reserve asset. Some 62% expected gold to grow its share of total reserves.23
We expect the confluence of central bank policies, Treasury liquidity impairment, inflationary pressures and geopolitical factors to have positive effects on gold prices in 2024. Central bank buying and investor hedging against potential policy shifts and economic uncertainties are likely to drive robust demand, highlighting gold’s enduring appeal and strategic importance in a turbulent economic landscape. Strong fundamentals may also be indicated by gold’s textbook bullish ascending triangle chart pattern (see Figure 6).
Figure 6. Gold Technicals Signal Strength
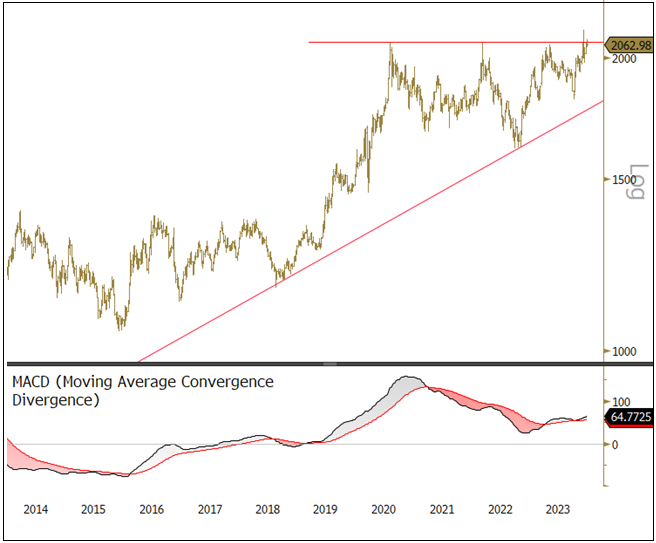
Source: Bloomberg. Gold bullion spot price, U.S. dollar/oz. Data as of 1/5/2024. Moving average convergence/divergence is a trend-following momentum indicator that shows the relationship between two exponential moving averages. Included for illustrative purposes only. Past performance is no guarantee of future results.
#10. Silver’s Breakout Year?
Several significant headwinds kept silver range-bound in 2023. Investment demand slowed in anticipation of rising interest rates and slower economic growth, notably in the U.S. and China. High carry costs and elevated lease rates prompted the release of silver into the physical market, further loosening conditions.
The outlook for silver is more promising. A dovish pivot in monetary policy is expected around mid-2024 and could lead to more supportive market flows for silver. Silver may likely benefit as the economy — and particularly the industrial sector — recovers. We expect silver prices to improve, driven by lower interest rates, more robust physical investment, ETF purchases and increased industrial demand. With higher volatility than gold, silver has the potential to outperform during the rally phase as it plays catch-up to gold's price moves.
Over the long term, supply-demand factors influence silver. Constraints in mining capacity could impact supply. If China's demand for lead and zinc remains weak, silver supply could decline because approximately 80% of silver production occurs as a by-product of lead-zinc and other metals production. Additionally, as the world shifts towards net-zero, silver demand is expected to rise significantly due to its use in solar panels and EVs (see Central Banks Support Gold & Solar PV Demand Buoys Silver). In summary, while the silver market faces challenges, it is poised for a potential upswing in 2024.
Changes in monetary policy, economic recovery and increasing industrial demand from sectors like solar energy and electrification are expected to drive this resurgence. Technical patterns in the silver market also suggest the potential for an explosive move higher (see Figure 7).
Figure 7. Silver’s Bullish Flag Pattern
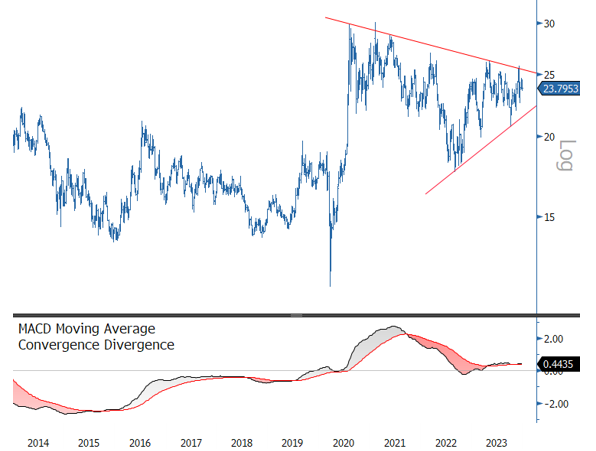
Source: Bloomberg. Silver bullion spot price, U.S. dollar/oz. Data as of 1/5/2024. Moving average convergence/divergence is a trend-following momentum indicator that shows the relationship between two exponential moving averages. Included for illustrative purposes only. Past performance is no guarantee of future results.
Critical Materials: 2023 Performance
| Metric | 12/29/2023 | 11/30/2023 | Change | % Chg | YTD Chg | Analysis |
| Miners | ||||||
| Nasdaq Sprott Energy Transition Materials™ Index1 | 985.91 | 910.84 | 75.08 | 8.24% | 5.57% |
China’s weak economic data and deteriorating credit liquidity issues negatively impacted metal commodities in 2023. Metal miners tied to China faced sharp markdowns, while uranium miners equities surged as spot uranium prices soared on firming fundamental support from utilities contracting U3O8, supply concerns, and upwardly revised L-T growth projections. Resource commodity assets rallied in Q4 due to a sharp fall in the U.S. dollar and bond yields, as consensus shifted towards a soft landing scenario and the end of the Fed’s rate hike cycle. |
| Nasdaq Sprott Lithium Miners™ Index2 | 736.47 | 655.45 | 81.02 | 12.36% | (20.15)% | |
| North Shore Global Uranium Mining Index3 | 3,846.25 | 3,743.29 | 102.96 | 2.75% | 58.48% | |
| Solactive Global Copper Miners Index4 | 143.06 | 129.08 | 13.98 | 10.83% | 9.80% | |
| Nasdaq Sprott Nickel Miners™ Index5 | 661.01 | 673.49 | (12.48) | (1.85)% | (27.36)% | |
| NYSE Arca Gold Miners Index | 876.44 | 866.82 | 9.62 | 1.11% | 8.81% | |
| Nasdaq Sprott Junior Copper Miners™ Index6 | 967.43 | 855.47 | 111.96 | 13.09% | 12.71% | |
| Nasdaq Sprott Junior Uranium Miners™ Index7 | 1,454.75 | 1,464.19 | (9.44) | (0.64)% | 41.74% | |
| Physical Materials | ||||||
| Lithium Carbonate Spot Price $/lb8 | 6.16 | 7.34 | (1.18) | (16.05)% | (81.95)% |
Prices plummet from unsustainable highs |
| U3O8 Uranium Spot Price $/lb9 | 91.09 | 80.73 | 10.36 | 12.83% | 88.54% |
Prices skyrocket as fundamentals strengthen |
| LME Copper Spot Price $/lb10 | 3.84 | 3.80 | 0.03 | 0.91% | 1.19% |
Holds its ground on energy transition demand |
| LME Nickel Spot Price $/lb11 | 7.43 | 7.46 | (0.03) | (0.38)% | (45.21)% |
Prices fall on EV slowdown and supply increase |
| Gold Spot Price $/oz | 2,062.98 | 2,036.41 | 26.57 | 1.30% | 13.10% |
Dominated by central bank & sovereign buying |
| Silver Spot Price $/oz | 23.80 | 25.27 | (1.48) | (5.84)% | (0.66)% |
Narrow trade band despite negative macro |
| Benchmarks | ||||||
| S&P 500 TR Index12 | 4,769.83 | 4,567.80 | 202.03 | 4.42% | 24.23% |
Remarkable year for the broad equity market as AI frenzy trumped higher yields, rising U.S. dollar and falling EPS outlook. By Q4, dovish signals from the Fed & Treasury Dept triggered a sharp fall in yields and the dollar, catalyzing an "everything rally." |
| DXY US Dollar Index13 | 101.33 | 103.50 | (2.16) | (2.09)% | (2.11)% | |
| BBG Commodity Index14 | 98.65 | 101.81 | (3.16) | (3.10)% | (12.55)% | |
| S&P Metals & Mining Index15 | 3,063.68 | 2,797.94 | 265.74 | 9.50% | 20.07% | |
*Mo % Chg and YTD % Chg for this Index are calculated as the difference between the month end's yield and the previous period end's yield, instead of the percentage change. BPS stands for basis points.
- For the latest standardized performance of the Sprott Energy Transition ETFs, please visit the individual website pages: SETM, LITP, URNM, URNJ, COPJ and NIKL. Past performance is no guarantee of future results.
Footnotes
| 1 | The Nasdaq Sprott Energy Transition Materials™ Index (NSETM™) is designed to track the performance of a selection of global securities in the energy transition materials industry, and was co-developed by Nasdaq® and Sprott Asset Management LP. |
| 2 | The Nasdaq Sprott Lithium Miners™ Index (NSLITP™) is designed to track the performance of a selection of global securities in the lithium industry, including lithium producers, developers and explorers; the Index was co-developed by Nasdaq® and Sprott Asset Management LP. |
| 3 | The North Shore Global Uranium Mining Index (URNMX) is designed to track the performance of companies that devote at least 50% of their assets to the uranium mining industry, which may include mining, exploration, development and production of uranium, or holding physical uranium, owning uranium royalties or engaging in other non-mining activities that support the uranium mining industry. |
| 4 | The Solactive Global Copper Miners Index includes international companies active in exploration, mining and/or refining of copper. The index includes a minimum of 20 and a maximum of 40 members. The calculation is done in USD as a total return index. Index adjustments are carried out semi-annually. |
| 5 | Nasdaq Sprott Nickel Miners™ Index (NSNIKL™) is designed to track the performance of a selection of global securities in the nickel industry. |
| 6 | Nasdaq Sprott Junior Copper Miners™ Index (NSCOPJ™) is designed to track the performance of mid-, small- and micro-cap companies in copper-mining related businesses. |
| 7 | Nasdaq Sprott Junior Uranium Miners™ Index (NSURNJ™) is designed to track the performance of mid-, small- and micro-cap companies in uranium-mining related businesses. |
| 8 | The lithium carbonate spot price is measured by the China Lithium Carbonate 99.5% DEL. Source Bloomberg and Asian Metal Inc. Ticker L4CNMJGO AMTL Index. Data converted to pounds and to USD with Bloomberg FX Rates. |
| 9 | The U3O8 uranium spot price is measured by a proprietary composite of U3O8 spot prices from UxC, S&P Platts and Numerco. |
| 10 | The copper spot price is measured by the LME Copper Cash ($). Source Bloomberg ticker LMCADY. Data converted to pounds. |
| 11 | The nickel spot price is measured by the LME Nickel Cash ($). Source Bloomberg ticker LMNIDY. Data converted to pounds. |
| 12 | The S&P 500 or Standard & Poor's 500 Total Return Index is a market-capitalization-weighted index of the 500 largest U.S. publicly traded companies. |
| 13 | The U.S. Dollar Index (USDX, DXY) is an index of the value of the U.S. dollar relative to a basket of foreign currencies. |
| 14 | The Bloomberg Commodity Index (BCOM) is a broadly diversified commodity price index that tracks prices of futures contracts on physical commodities, and is designed to minimize concentration in any one commodity or sector. It currently has 23 commodity futures in six sectors. |
| 15 | The S&P Metals & Mining Select Industry Index comprises stocks in the S&P Total Market Index that are classified in the GICS metals & mining sub-industry. |
| 16 | Bloomberg, “Global Trade to Drop 5% This Year Amid Geopolitical Headwinds, December 11, 2023. |
| 17 | According to various sources, China has consumed about 100 million tons of refined copper since 2000. • China: copper consumption volume 2000-2022 | Statista • Copper consumption share by world region 2022 | Statista • Study on Copper Consumption in China and Abroad - Atlantis Press • Study on Copper Consumption in China and Abroad | Atlantis Press • Sustainable Development of the Chinese Copper Market |
| 18 | BloombergNEF. |
| 19 | CNBC, “Copper could skyrocket over 75% to record highs by 2025 — brace for deficits, analysts say”, January 2. 2024. |
| 20 | The New York Times, “22 Countries Pledge to Triple Nuclear Capacity in Push to Cut Fossil Fuels”, December 2, 2023. |
| 21 | Refers to gold held by exchange traded funds (that invest in gold bullion, and the positioning of speculative investors in the U.S. gold futures markets as reflected in the weekly commitment of traders report from the Commodity Futures Trading Commission (CFTC), a U.S. government agency. These are used as indicators of market sentiment for gold. |
| 22 | The Bloomberg US Government Securities Liquidity Index measures on average how far yields are away from where fair-value models say they should be. It is an indicator of how easily trades can be carried out in the U.S. Treasury bond market. A high index level indicates increased market volatility. |
| 23 | World Gold Council, “2023 Central Bank Gold Reserves Survey”, May 30, 2023. |
Important Disclosures
An investor should consider the investment objectives, risks, charges, and expenses of each fund carefully before investing. To obtain a fund’s Prospectus, which contains this and other information, contact your financial professional, call 1.888.622.1813 or visit SprottETFs.com. Read the Prospectus carefully before investing.
Exchange Traded Funds (ETFs) are considered to have continuous liquidity because they allow for an individual to trade throughout the day, which may indicate higher transaction costs and result in higher taxes when fund shares are held in a taxable account.
The funds are non-diversified and can invest a greater portion of assets in securities of individual issuers, particularly those in the natural resources and/or precious metals industry, which may experience greater price volatility. Relative to other sectors, natural resources and precious metals investments have higher headline risk and are more sensitive to changes in economic data, political or regulatory events, and underlying commodity price fluctuations. Risks related to extraction, storage and liquidity should also be considered.
Shares are not individually redeemable. Investors buy and sell shares of the funds on a secondary market. Only market makers or “authorized participants” may trade directly with the fund, typically in blocks of 10,000 shares.
The Sprott Active Gold & Silver Miners ETF and the Sprott Silver Miners & Physical Silver ETF are new and have limited operating history.
Sprott Asset Management USA, Inc. is the Investment Adviser to the Sprott ETFs. ALPS Distributors, Inc. is the Distributor for the Sprott ETFs and is a registered broker-dealer and FINRA Member. ALPS Distributors, Inc. is not affiliated with Sprott Asset Management USA, Inc.


