- View the monthly commentary on Copper, Lithium and Nickel.
- View Critical Materials June 2024 Performance Table
- For the latest standardized performance and holdings of the Sprott Energy Transition ETFs, please visit the individual website pages: SETM, LITP, URNM, URNJ, COPP, COPJ and NIKL. Past performance is no guarantee of future results.
Key Takeaways
Fourth Industrial Revolution: The world is in the midst of a fourth industrial revolution (or “4IR”) as technological developments like artificial intelligence (AI), robotics, IoT (Internet of Things), genetic engineering and quantum computing bring about an unprecedented integration of the digital, physical and biological realms.
4IR Profound Changes: Like previous industrial revolutions, 4IR is spurring increases in productivity and economic output and causing profound societal changes, including shifts in labor markets, urbanization and the roles of governments in managing economies.
Demand Pressures on Critical Materials: Electrification and green energy are pivotal to advancing 4IR technologies, and the resulting demand pressures on critical minerals like copper, lithium and uranium are sparking a new commodity supercycle.
Deglobalization and Trade Nationalism: The transition is unfolding against a backdrop of deglobalization and trade nationalism. Countries are investing more heavily in local renewable energy production to decrease reliance on global supply chains and enhance national energy security.
June in Review: Market Divergence Amid Energy Transition Pullback
The Nasdaq Sprott Energy Transition Materials (NSETM) Index fell sharply, losing 131.13 points (or 12.11%) in June to close the month at 951.58. The year-to-date return is -3.48% through June. After three straight months of impressive gains, all energy transition equity groups had a sharp correction in June. A combination of poor market depth, hyper-concentrated flows to select mega-tech names (mainly AI-related), more signs of slowing growth, slowing inflation and a higher U.S. dollar collided with the technically overbought energy transition materials complex. The NSETM Index remains in a consolidation trend (see Figure 1).
While the Bloomberg Commodity Index reported a modest 1.94% loss, the dispersion of commodity returns was broad. Crude oil rose 5.91%, while base metals copper and nickel fell 4.61% and 12.41%, respectively. Grains fell 11.26% on average. Throughout the month, there was a wide dispersion of returns across most assets and equity sectors.
The S&P 500 Index closed at an all-time monthly high, led by the technology group. An improved earnings outlook from the AI complex and falling bond yields expanded P/E multiples further. The concentration of market returns was notable as most non-technology-weighted indices (for example, equal-weighted, value, small-cap, cyclicals, etc.) declined in June.
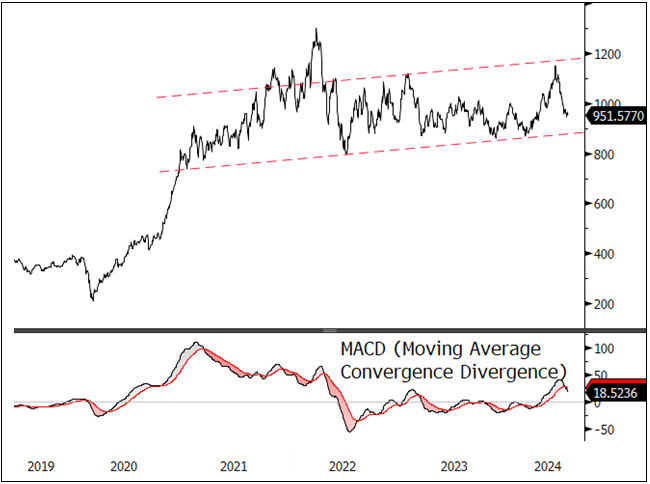
Source: Bloomberg. Nasdaq Sprott Energy Transition Materials (NSETM) Index. Data as of 6/30/2024. Moving average convergence/divergence is a trend-following momentum indicator that shows the relationship between two exponential moving averages (EMAs), calculated by subtracting the 26-period EMA from the 12-period EMA. Included for illustrative purposes only. Past performance is no guarantee of future results.
Energy Transition and the Fourth Industrial Revolution
The term “fourth industrial revolution” was popularized by Klaus Schwab of the World Economic Forum and is meant to convey the wide-ranging technological impact of digital, biological and physical integrations in the current era. While other terms can describe specific aspects of this technological era, 4IR is a broad descriptor that captures the extensive and interconnected nature of the ongoing transformations.
The global commodity market is witnessing a significant shift, underpinned by the ongoing energy transition and digital innovations associated with 4IR. This shift is starkly different from the commodity supercycle initiated by China's economic integration into the world trade system two decades ago, which was characterized by mass industrialization and urbanization.
In 2000, China's access to the World Trade Organization marked the beginning of a transformative era in global trade and commodity demand. From 2000 to 2010, China embarked on an aggressive path of rapid industrialization and infrastructure development, fueled by over 140 million workers entering its workforce.16 The Chinese government prioritized the manufacturing and infrastructure sectors to employ its burgeoning workforce, adopting a "hyperfinance" model characterized by massive debt accumulation.
This phase of intense urbanization required the construction of numerous cities, manufacturing facilities and associated infrastructure. This growth significantly boosted the demand for basic building materials such as steel (derived from iron ore and metallurgical coal) and for energy to make concrete by roasting limestone and clay. The energy required to produce these materials was substantial.17
The decade following China's WTO entry saw an insatiable appetite for virtually every commodity, driving the commodity supercycle of the 2000s. Iron ore prices went from an average of roughly $13 per ton in the 1990-2003 period to about $78 per ton in the supercycle growth phase (2004-2012), a six-fold increase (see Figure 2). For several years, iron ore prices traded at over 10x the pre-China-WTO price levels. Crude oil prices saw a similar trend, rising roughly 4x over the same period.
Figure 2. Building Cities with Oil and Iron (1995-2024)
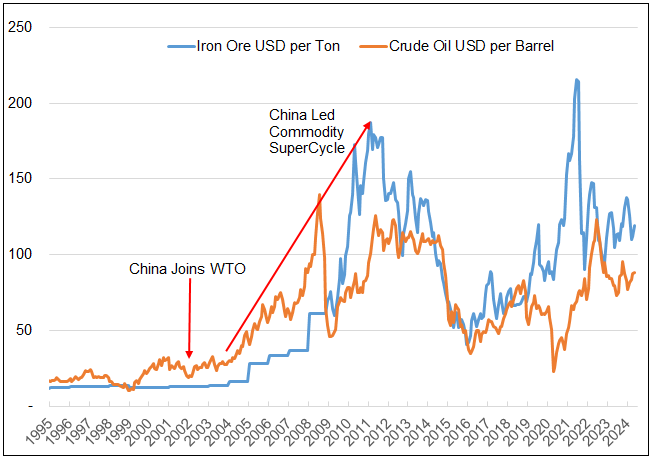
Source: U.S. Federal Reserve Economic Data, Bloomberg. Global iron ore and crude oil prices during the China-led commodity supercycle.
Green Energy Powers the New Cycle
The current commodity cycle differs significantly from the supercycle two decades ago. Today's focus is not on mass industrialization and urbanization but on electrification and the adoption of green energy solutions. These are pivotal to advancing 4IR technologies and are occurring on a global scale. This era is defined by the convergence of digitization (AI, IoT, big data), automation (robotics, autonomous systems), connectivity (5G, cloud, edge computing) and other technological advances. These technologies are not only transformative but also intensive consumers of high-quality electricity.
Copper and uranium are at the forefront of this new cycle.
The primary commodities at the forefront of this new cycle are copper and uranium (versus iron ore, metallurgical coal and crude oil). Copper is essential due to its superior electrical conductivity, which is crucial for efficient energy transmission in an increasingly electrified world. Uranium plays a key role due to the scale at which nuclear power can be generated, offering a stable and substantial supply of low-carbon electricity. As the rollout of new technologies progresses, the demand for these and other energy transition minerals like lithium, nickel, rare earths and silver is expected to surge.
4IR Accelerates
The fourth industrial revolution builds on the three previous industrial revolutions, each distinct in how it created shifts in manufacturing, economic structures and human development:
-
First Industrial Revolution (18th to 19th Century)
- Mechanization: This revolution introduced mechanized production facilities, which replaced hand production methods, vastly increasing production speed and volume.
- Energy Shift: The use of water and steam power was a significant shift away from human or animal power, enabling factories to increase productivity and reduce reliance on physical labor.
- Economic Structural Change: There was a shift from rural, agrarian economies to urban, industrialized settings. This shift led to the growth of factory towns and cities and the emergence of a new urban working class.
-
Second Industrial Revolution (Late 19th to Early 20th Century)
- Mass Production: Technologies such as the assembly line introduced during this period allowed for the mass production of goods, dramatically lowering costs and making products like automobiles and consumer goods affordable by the masses.
- Electrification: The widespread adoption of electrical power transformed industries by providing more reliable and flexible power sources than steam. Electricity also led to the development of new sectors like appliances, and improved communications (telegraph and telephone).
- Global Economic Integration: Improvements in transportation (railroads and shipping) and communication systems expanded international trade and marked the beginnings of a globalized economy.
-
Third Industrial Revolution (Late 20th Century)
- Digitalization: The rise of electronics, information technology and telecommunications reshaped economies by enabling the automation of production and the digital management of supply chains.
- Globalization: Advances in IT and logistics further globalized production and markets, allowing companies to operate and compete globally, which in turn increased the interdependence of global economies.
- Service Economy: There was a significant shift from manufacturing to service-based industries. The rise of IT sectors and increased focus on knowledge and technology services transformed traditional economic models.
Each of the first three industrial revolutions spurred increases in productivity and economic output and led to profound societal changes, including shifts in labor markets, urbanization and the roles of governments in managing economies. 4IR is building on these foundations to create even more integrated and complex economic interactions.
4IR began emerging around the early 2000s and is accelerating rapidly due to technological advances in AI, robotics, IoT, genetic engineering, quantum computing and more. These technologies integrate the physical, digital and biological worlds, and have wide influence across disciplines, economies and industries. A current example is smart manufacturing, where companies have integrated digital and physical systems within their factories, utilizing IoT, AI and robotics to optimize production processes and improve efficiency and customization.18 Possible future examples include autonomous vehicles and transportation, as well as AI and robotics themselves.
4IR Transforms Energy Systems
4IR is profoundly reshaping energy systems around the world. It is altering how energy is produced and consumed, and revolutionizing the entire energy infrastructure, making these systems more connected, smarter and capable of sustaining higher levels of renewable energy. This transformation is being driven by the rapid advancement and integration of technologies like AI and IoT along with renewable energy technologies and digital communication. It promises to bring about a significant reduction in global carbon emissions with several key developments:
- Integration of Renewable Energy
Technological innovations in solar, wind and other renewable sources are central to 4IR. These technologies are becoming more cost-effective and efficient, facilitated by advances in materials science and engineering and sheer economies of scale. The digitalization of energy systems allows intermittent energy sources to be integrated with the power grid. Smart grids, which use IoT and AI to manage and distribute energy efficiently, can dynamically adjust to changes in energy supply and demand, accommodating the variability of renewable energies. - Energy Storage Innovation
Advancements in lithium-ion battery storage are crucial for mitigating the intermittent nature of renewable energy. Energy storage systems enable surplus power to be stored and then released when demand is high or renewable generation is low, thus stabilizing the grid. Innovations in this area are rapidly evolving, reducing costs and enhancing the efficiency of energy storage solutions. - Smart Grids and Meters
Smart grids leverage IoT sensors, AI and data analytics to monitor and manage energy flows across the network. This technology allows for real-time adjustments to energy production and distribution, enhancing efficiency and reliability. Smart meters, meanwhile, provide detailed and accurate real-time data on energy consumption directly to consumers and energy providers, promoting energy efficiency. - Decentralized Energy Systems
4IR is facilitating a shift toward more decentralized energy systems, where energy can be generated and stored closer to where it is used rather than at large, centralized plants. This decentralization is made possible by small-scale renewable installations coupled with local battery storage systems. Decentralized energy systems reduce energy loss in transmission and increase grid resilience. They can significantly lower the carbon footprint of energy generation. - Electrification and Digitalization in Transport
EVs are integral to the shift toward more sustainable energy systems supported by 4IR technologies. EVs not only reduce reliance on fossil fuels but also serve as mobile storage units that can interact with the grid through vehicle-to-grid (V2G) technologies. This interaction allows EVs to discharge electricity back into the grid when needed, providing additional flexibility and stability. - AI in Energy Management
AI is used to optimize energy production, distribution and consumption. It can predict energy demand and supply fluctuations, enhance the operation of power plants, and improve maintenance procedures through predictive analytics. AI also helps integrate and manage distributed energy resources and renewables, optimizing their output and integration into the grid.
4IR Needs High-Quality Electricity
High-quality electricity is crucial for the successful deployment and operation of 4IR technologies. This type of electricity is defined by its reliability, stability and stable voltages and frequency, ensuring operational efficiency, safety and minimal disruption in digitally-driven and automated environments. It differs significantly from standard electricity, which may suffice for residential and commercial uses but falls short in meeting the stringent demands of 4IR applications, which are growing in complexity. Key features of high-quality electricity include:
- Stability: Vital for applications like data centers, where voltage and frequency variations can cause data corruption or hardware damage.
- Reliability: Essential for critical facilities such as hospitals and manufacturing plants that require an uninterrupted power supply to minimize safety risks and operational disruptions during outages.
- Clean Power: Necessary to protect sophisticated electronics in IoT devices and robotics from harmonics, voltage spikes, and electromagnetic interference.
Utilizing smart grid technologies that feature real-time anomaly detection and correction is crucial for maintaining high power quality and ensuring a consistent power supply. Integrating renewable energy with advanced management and storage solutions not only helps stabilize the grid but also enhances its technical stability. Renewable energy provides essential grid support services such as frequency and voltage control, which are vital for maintaining grid stability.
Despite the challenges posed by the variability and intermittency of renewable sources, advanced grid management and energy storage solutions are necessary to ensure consistent power quality. In 4IR, renewable energy plays a pivotal role, creating a synergy between technological advancement and sustainable energy practices. This alignment is critical as industries transition to more sustainable operations, reducing dependency on fossil fuels, enhancing overall energy security and creating a more efficient, eco-friendly electrification process.
4IR Needs New Infrastructure
As 4IR intensifies, the U.S. electrical infrastructure is under significant pressure. There is urgent need to modernize the electrical grid to keep pace with the rapidly growing 4IR economy.
For example, the demand for a robust infrastructure to support AI technologies and data centers, which are major power consumers, is not only putting pressure on the U.S. electrical grid but also significantly impacting commodity markets, particularly copper. The integration of AI and other 4IR technologies with the existing infrastructure implies a potential supercycle for copper, driven by the necessity for enhanced electrical systems. This demand supports forecasts of a copper supply crisis and the need for substantial price increases to incentivize new mining operations (see Sprott Energy Transition Materials Monthly, April 2024 and May 2024).
Central to the 4IR transformation are critical minerals like copper, uranium, lithium and nickel. These are pivotal in transitioning toward more sustainable and interconnected energy systems. Copper, essential for its superior electrical conductivity, is fundamental in manufacturing renewable energy technologies such as wind turbines, solar panels and EVs. The International Energy Agency projects that global copper demand could double over the next two decades, fueled by investments in renewable energy and the electrification of transport.
Uranium continues to play a crucial role as a primary fuel for nuclear power, which can provide a reliable, low-carbon source of electricity that complements the intermittent nature of renewable sources. As nuclear reactor technology advances—for example, small modular reactors (SMRs)—uranium's importance is expected to grow significantly within the 4IR framework. Lithium and nickel, essential components of lithium-ion batteries, are increasingly critical as the electrification of transport accelerates. Lithium-ion batteries power everything from EVs to large-scale energy storage systems that are vital for balancing grids reliant on renewable energy. Nickel enhances the energy density and extends the lifespan of these batteries, further supporting the transition to EVs and boosting demand for these minerals.
Balancing supply and demand dynamics, modernizing the grid and scaling up mineral extraction will be crucial to sustaining the growth and deployment of transformative technologies in the 4IR era, aligning technological progress with environmental sustainability and energy security.
The chart below (Figure 3) shows which critical minerals are most in demand and thus likely to have supply-demand deficits.
Figure 3. Critical Minerals: Levels of Importance
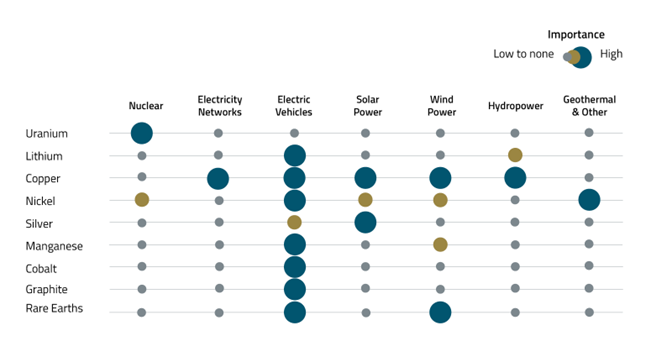
Source: European Commission, “Critical raw materials for strategic technologies and sectors in the EU, A foresight study,” March 9, 2020. IEA, “The role of critical minerals in clean energy transitions,” May 2021. McKinsey analysis.
4IR Puts Supply Chains at Risk
4IR is at the forefront of the shift toward decarbonization, more efficient renewable energy technologies and smart grids that optimize energy use and integrate diverse power sources effectively. Despite these advancements, the energy sector, a major contributor to global greenhouse gas emissions, is under significant pressure from the escalating impacts of climate change. This highlights the critical role of renewable technologies in addressing global warming.
The transition, however, is unfolding against a backdrop of increasing deglobalization characterized by political tensions, trade wars and nationalist policies. These dynamics are fragmenting markets and complicating supply chains. They pose considerable challenges to the electricity sector’s attempts to acquire the critical materials needed to manufacture high-efficiency renewable energy components like photovoltaic cells and wind turbines.
The rapid pace of 4IR technologies, along with soaring demand for green energy, not only accelerates electricity demand but also exposes supply chains to risks. As countries increasingly lean toward nationalism, there is a growing push to prioritize national priorities over international benefits. In response, countries are likely to invest more in local renewable energy production to decrease reliance on fossil fuel global supply chains.19 These emerging strategies align with both 4IR innovations and climate goals and are crucial for enhancing national energy security and independence in an uncertain global landscape.
Updates on Critical Materials
Copper: Overall Trend Is Up
The copper spot price fell 4.61% to $4.29 per pound in June (see Figure 4). Copper prices retraced some of their gains but remain on their upward trajectory with a year-to-date gain of 11.72%. Copper miners and junior copper miners have performed similarly but with additional leverage to the underlying copper price. Year-to-date, they are up 25.41% and 17.93%, respectively. This action is occurring amid a broader metals market sell-off that occurred in June (which is reversing in early July) and a decline in investment fund buying, even though longs remain near record highs.
One key development is that China's Purchasing Managers' Index (PMI) has hit its highest level since May 2021. This is positive for copper because a higher PMI indicates stronger industrial activity and manufacturing growth in China, which is the world's largest consumer of copper, accounting for 56% of the global total in 2023.
Despite the short-term consolidation, the overall trend for copper remains upward and several factors contribute to a bullish outlook. Chinese smelters are cutting production due to plummeting treatment costs. Additionally, the U.S. and UK have sanctioned Russian copper, fragmenting global supply. BHP's bid to acquire Anglo American has ignited investor interest, highlighting potential mergers and acquisitions (M&A) activity that may suggest the industry continues to prefer buying existing assets over developing new ones.
While M&A may benefit pure-play copper miners, it does not create additional copper supply. As a result, the long-term fundamentals for copper remain strong, driven by escalating supply deficits. The world still relies on decades-old copper discoveries, as demand is increasing due to advancements in AI and efforts to electrify the global economy.
Figure 4. Market Pressures Weigh on Copper Prices (2019-2024)
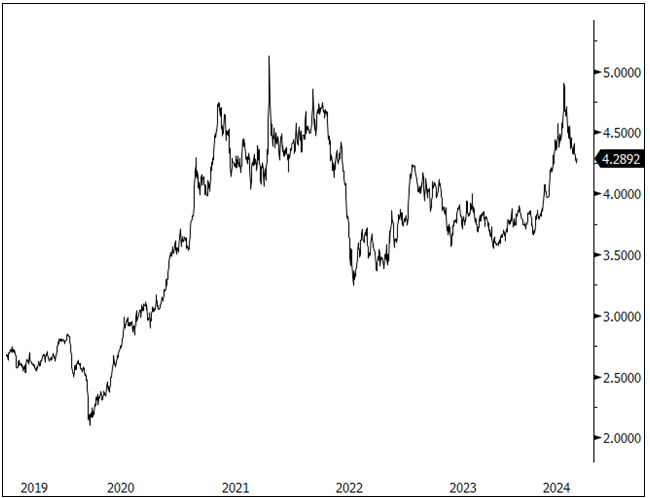
Source: Bloomberg. Copper spot price, $/lb. Data as of 6/29/2024. Included for illustrative purposes only. Past performance is no guarantee of future results.
Lithium: A New Bottom?
The lithium spot price fell 13.57% in June, hitting its lowest level in 39 months and completely wiping out the 2021-2022 boom (see Figure 5). Mining stocks performed similarly, declining 22.28%. With lithium destocking relenting and mines cutting production, current prices are unsustainable to incentivize investment in required future production. As such, we believe this may form the new bottom.
The EU has followed the U.S. and announced tariffs on Chinese electric vehicles (EVs) that range from 17% to 38% on top of an existing 10% duty.20 The EU found that China’s EV value chain is benefiting from unfair subsidization and causing a threat to EU EV producers. This follows the increase in U.S. tariffs from 25% to 100% on passenger EVs and from 7.5% to 25% on lithium-ion batteries announced in May. However, the U.S. tariffs were mostly symbolic, as the country currently imports almost no Chinese EVs. Europe, on the other hand, imports a significant amount of Chinese EVs, with the value surging from $1.6 billion in 2020 to $11.5 billion in 2023.21 The new tariffs will likely not close the EU market to Chinese EVs, as analysis shows tariffs would have to be 45%-55% to render them uncompetitive.22 However, they should mitigate against excessive Chinese dominance.
Ultimately, the EU and U.S. actions will help to reshore supply chains and create new opportunities for increasing investment in other regions. Notably, these moves exacerbate the upcoming lithium supply deficit as EVs hit record sales, with 3.2 million sold globally in Q1 2024, representing 18.3% of passenger vehicle sales and a 24% increase from the same period last year. In the long term, the sources of demand for lithium may shift, but ultimately, demand will still be significant.
We believe that there may be limited price downside in lithium. This is due to the severe drop already priced in and the fact that much of the increase in lithium production has been from Chinese lepidolite (higher cost and lower grade), which may be priced out at these unsustainably low levels. As time passes and lithium destocking winds down, potential Chinese stimulus, interest rate cuts and the U.S. election remain elements to watch.
There is tension in the current lithium environment between the short-term impact of negative sentiment and longer-term positive fundamentals that will come to light. Exxon and lithium miners came to the industry’s defense at the Fastmarkets Lithium Supply and Raw Battery Materials Conference in June, stating that they are continuing to back EV-demand growth and are committed to lithium investment.23
Figure 5. Short-Term Negatives Wipe Out Gains for Lithium (2019-2024)
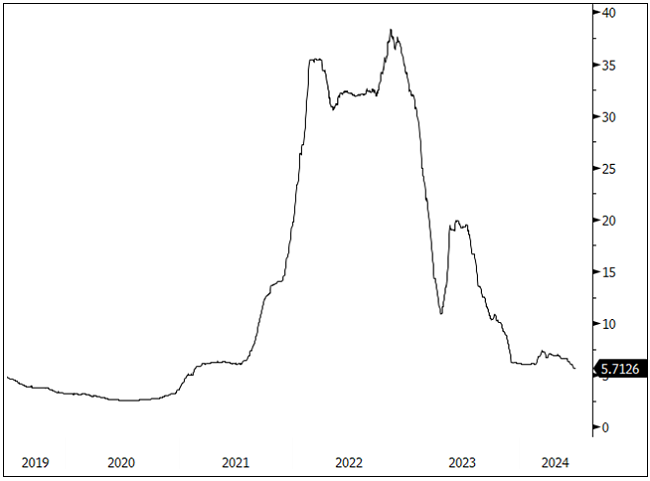
Source: Bloomberg. Lithium carbonate spot price, $/lb. Data as of 6/29/2024. Included for illustrative purposes only. Past performance is no guarantee of future results.
Nickel: Investment Selling Pressure
Nickel began June with an 18.81% gain year-to-date, but as June brought challenges for all commodities, nickel lost 12.41% during the month (see Figure 6). At the end of June, nickel was up 4.06% year-to-date and nickel miners were down 6.54%, despite the previous strong gains in April and May. Nickel’s June downtrend was the result of significant selling of long positions by investment funds rattled by the stronger U.S. dollar and China’s weakened economy.
Although continued unrest in New Caledonia has put pressure on nickel supply, overall the market remains in surplus, driven by overproduction in Indonesia and softening demand from China. Falling nickel prices have put pressure on producers outside Indonesia. For example, BASF, the chemical company, and French miner Eramet canceled a joint nickel-cobalt refining project in Indonesia due to falling prices and the oversupplied market.
As mentioned in last month’s report, nickel miners in the West will likely get a boost from new U.S. guidance starting in 2025 that incentivizes car manufacturers to avoid using critical materials owned or controlled by a Foreign Entity of Concern (FEOC), which includes China, Russia, Iran and North Korea. Ultimately, the world’s shift to policies that impede globalization is inflationary for nickel prices.
Figure 6. Nickel Price Falls on Oversupply (2019-2024)
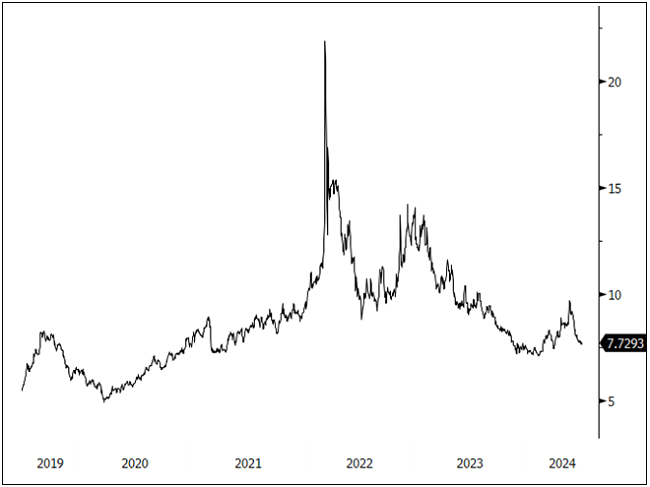
Source: Bloomberg. Nickel spot price, $/lb. Data as of 6/29/2024. Included for illustrative purposes only. Past performance is no guarantee of future results.
June 2024 Performance
| Metric | 6/30/2024 | 5/31/2024 | Change | % Chg | YTD Chg | Monthly Comment |
| Miners | ||||||
| Nasdaq Sprott Energy Transition Materials™ Index1 | 951.58 | 1,082.71 | (131.13) | (12.11)% | (3.48)% |
After three straight months of impressive gains, the energy transition equity groups had a sharp correction in June across the board. A combination of poor market depth, hyper-concentrated flows to select mega tech, more signs of slowing growth and slowing inflation, higher USD, etc., collided with the overbought commodity resource complex. |
| Nasdaq Sprott Lithium Miners™ Index2 | 451.57 | 581.00 | (129.44) | (22.28)% | (38.68)% | |
| North Shore Global Uranium Mining Index3 | 3,977.39 | 4,518.90 | (541.51) | (11.98)% | 3.41% | |
| Nasdaq Sprott Copper Miners Index4 | 1,312.13 | 1,399.87 | (87.74) | (6.27)% | 25.41% | |
| Nasdaq Sprott Nickel Miners™ Index5 | 617.76 | 718.23 | (100.48) | (13.99)% | (6.54)% | |
| Nasdaq Sprott Junior Copper Miners™ Index6 | 1,140.93 | 1,239.34 | (98.42) | (7.94)% | 17.93% | |
| Nasdaq Sprott Junior Uranium Miners™ Index7 | 1,510.79 | 1,797.08 | (286.29) | (15.93)% | 3.85% | |
| Physical Materials | ||||||
| Lithium Carbonate Spot Price $/lb8 | 5.71 | 6.61 | (0.90) | (13.57)% | (7.35)% |
Completes the full wipe out of the previous boom |
| U3O8 Uranium Spot Price $/lb9 | 85.34 | 89.35 | (4.01) | (4.49)% | (6.32)% |
Continues to consolidate |
| LME Copper Spot Price $/lb10 | 4.29 | 4.50 | (0.21) | (4.61)% | 11.72% |
Retraces amid longer-term upward trend |
| LME Nickel Spot Price $/lb11 | 7.73 | 8.82 | (1.10) | (12.41)% | 4.06% |
Falling after two months of strong gains |
| Benchmarks | ||||||
| S&P 500 Index12 | 5,460.48 | 5,277.51 | 182.97 | 3.47% | 14.48% |
The S&P 500 Index closed at all-time monthly highs led by the technology group on higher earnings outlook and falling bond yields. DXY increased due to the EU parliamentary election results, falling yen, and continuing U.S. economic strength |
| DXY US Dollar Index13 | 105.87 | 104.67 | 1.19 | 1.14% | 4.47% | |
| BBG Commodity Index14 | 100.99 | 102.99 | (2.00) | (1.94)% | 2.38% | |
| S&P Metals & Mining Index15 | 3,039.77 | 3,296.25 | (256.48) | (7.78)% | (0.78)% | |
*Mo % Chg and YTD % Chg for this Index are calculated as the difference between the month end's yield and the previous period end's yield, instead of the percentage change. BPS stands for basis points.
- For the latest standardized performance and holdings of the Sprott Energy Transition ETFs, please visit the individual website pages: SETM, LITP, URNM, URNJ, COPP, COPJ and NIKL. Past performance is no guarantee of future results.
Footnotes
| 1 | The Nasdaq Sprott Energy Transition Materials™ Index (NSETM™) is designed to track the performance of a selection of global securities in the energy transition materials industry, and was co-developed by Nasdaq® and Sprott Asset Management LP. |
| 2 | The Nasdaq Sprott Lithium Miners™ Index (NSLITP™) is designed to track the performance of a selection of global securities in the lithium industry, including lithium producers, developers and explorers; the Index was co-developed by Nasdaq® and Sprott Asset Management LP. |
| 3 | The North Shore Global Uranium Mining Index (URNMX) is designed to track the performance of companies that devote at least 50% of their assets to the uranium mining industry, which may include mining, exploration, development and production of uranium, or holding physical uranium, owning uranium royalties or engaging in other non-mining activities that support the uranium mining industry. |
| 4 | The Nasdaq Sprott Copper Miners™ Index (NSCOPP™) is designed to track the performance of a selection of global securities in the copper industry. |
| 5 | Nasdaq Sprott Nickel Miners™ Index (NSNIKL™) is designed to track the performance of a selection of global securities in the nickel industry. |
| 6 | Nasdaq Sprott Junior Copper Miners™ Index (NSCOPJ™) is designed to track the performance of mid-, small- and micro-cap companies in copper-mining related businesses. |
| 7 | Nasdaq Sprott Junior Uranium Miners™ Index (NSURNJ™) is designed to track the performance of mid-, small- and micro-cap companies in uranium-mining related businesses. |
| 8 | The lithium carbonate spot price is measured by the China Lithium Carbonate 99.5% DEL. Source Bloomberg and Asian Metal Inc. Ticker L4CNMJGO AMTL Index. Data converted to pounds and to USD with Bloomberg FX Rates. |
| 9 | The U3O8 uranium spot price is measured by a proprietary composite of U3O8 spot prices from UxC, S&P Platts and Numerco. |
| 10 | The copper spot price is measured by the LME Copper Cash ($). Source Bloomberg ticker LMCADY. Data converted to pounds. |
| 11 | The nickel spot price is measured by the LME Nickel Cash ($). Source Bloomberg ticker LMNIDY. Data converted to pounds. |
| 12 | The S&P 500 or Standard & Poor's 500 Index is a market-capitalization-weighted index of the 500 largest U.S. publicly traded companies. |
| 13 | The U.S. Dollar Index (USDX, DXY) is an index of the value of the U.S. dollar relative to a basket of foreign currencies. |
| 14 | The Bloomberg Commodity Index (BCOM) is a broadly diversified commodity price index that tracks prices of futures contracts on physical commodities, and is designed to minimize concentration in any one commodity or sector. It currently has 23 commodity futures in six sectors. |
| 15 | The S&P Metals & Mining Select Industry Index comprises stocks in the S&P Total Market Index that are classified in the GICS metals & mining sub-industry. |
| 16 | World Bank Group chart, “Labor force, total – China”. |
| 17 | U.S. Federal Reserve chart, “Global price of Iron Ore”. For example, one cubic meter of concrete requires 0.37 barrels of oil. To build a new city for just one million people would require approximately 250 million barrels of oil, 16 million tonnes of iron ore and 8 million tonnes of coal. Consider that China urbanized 140 million people in the early part of the 21st century and the sheer scale of its rapid industrialization becomes clearer. |
| 18 | Germany calls this “Industry 4.0”, which is really a subset of 4IR. Siemens is a leader in this area. |
| 19 | For example, Ethiopia has banned ICE vehicles. The capital saved on reducing oil imports could be used to build solar farms, with an investment payback of about five years followed by free power for the next 20 years. With its near-desert, high-altitude environment, Ethiopia has huge solar power potential. If you combine the developing world’s low labor costs with cheap reliable power, it could be a global industrial game changer. |
| 20 | European Commission, “Commission investigation provisionally concludes that electric vehicle value chains in China benefit from unfair subsidies,” June 12, 2024. |
| 21 | CSIS, “Unpacking the European Union’s Provisional Tariff Hikes on Chinese Electric Vehicles,” June 21, 2024. |
| 22 | Rhodium Group, “Ain’t No Duty High Enough,” April 29, 2024. |
| 23 | Mining.com, “Lithium producers bullish on long-term demand despite recent price drop,” June 27, 2024. |
Important Disclosures
An investor should consider the investment objectives, risks, charges and expenses of each fund carefully before investing. To obtain a fund’s Prospectus, which contains this and other information, contact your financial professional, call 1.888.622.1813 or visit SprottETFs.com. Read the Prospectus carefully before investing.
Exchange Traded Funds (ETFs) are considered to have continuous liquidity because they allow for an individual to trade throughout the day, which may indicate higher transaction costs and result in higher taxes when fund shares are held in a taxable account.
Diversification does not protect against loss. The funds are non-diversified and can invest a greater portion of assets in securities of individual issuers, particularly those in the natural resources and/or precious metals industry, which may experience greater price volatility. Relative to other sectors, natural resources and precious metals investments have higher headline risk and are more sensitive to changes in economic data, political or regulatory events, and underlying commodity price fluctuations. Risks related to extraction, storage and liquidity should also be considered.
Shares are not individually redeemable. Investors buy and sell shares of the funds on a secondary market. Only “authorized participants” may trade directly with the fund, typically in blocks of 10,000 shares.
The Sprott Active Metals & Miners ETF is new and has limited operating history.
Sprott Asset Management USA, Inc. is the Investment Adviser to the Sprott ETFs. ALPS Distributors, Inc. is the Distributor for the Sprott ETFs and is a registered broker-dealer and FINRA Member. ALPS Distributors, Inc. is not affiliated with Sprott Asset Management USA, Inc.


