Key Takeaways
- Copper’s Role in Clean Energy: Copper is essential in renewable energy and EVs, with its demand in clean energy projected to reach 61% by 2040 as part of the global energy transition.
- Supply and Demand Imbalance: Growing demand for copper, estimated at 427 million metric tons by 2050, faces supply challenges due to declining ore quality and geopolitical issues in top-producing regions.
- Investment in Energy Transition: Investment in clean energy is surging, with trillions needed annually to achieve net-zero by 2050, highlighting copper’s critical role in supporting sustainable growth.
- Market and Mining Dynamics: Copper mining investments focus on existing operations rather than new projects, leading to increased M&A activity as companies secure future supplies to meet rising demand.
Copper's Storied History
Copper's story runs deep in human history, dating back over 10,000 years.1 It was one of the first metals humans mastered, shaping coins, jewelry, tools and weaponry that fueled societal advancement. Prized for its durability, malleability and dependability, copper's journey took a historic turn in the 1800s when its exceptional electrical conductivity sparked the revolutionary age of telegraphy and incandescent electric lamps to light homes. Today, in the United States alone, copper is a critical mineral for our infrastructure, including nearly 7 million miles of electrical wires powering homes, businesses and industry.2
Copper is used in vast applications in many industries, making it a reliable indicator of global economic health. In 2022, the copper market was valued at US$183 billion, ranking third among metals (behind iron ore and gold).3 But copper's story is evolving. While traditionally used in construction and electronics, its new frontier is clean energy. This sector currently consumes 25% of global copper demand, and this figure is projected to move higher to 61% by 2040, given our growing reliance on wind, solar and electric vehicles.4
Figure 1. Copper: The Multi-Purpose Red Metal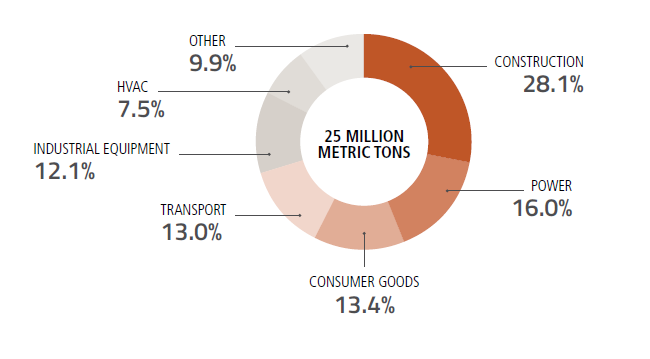
Source: BloombergNEF. Note: “HVAC” refers to heating, ventilation and air conditioning. Included for illustrative purposes only.
Copper Is Essential for Decarbonization
Copper plays a pivotal role in the shift toward clean, carbon-free energy. Power grids and electric vehicles heavily depend on copper for efficient electricity transmission. In recognition of its vital role, copper has been designated as a critical mineral by major global players, including the European Union, the U.S., Canada, Japan, China and India.5
At the UN’s COP28 climate summit in late 2023, 118 governments pledged to triple the world’s renewable energy capacity by 2030 to help lessen the global reliance on fossil fuels for energy production. The journey to global net-zero emissions by 2050 may likely see copper taking center stage in its role as the leading transmission metal. However, existing copper supplies are dwindling, and new mines take years to develop. This is creating a race to meet increasing copper demand that is more urgent than ever.
This shift to cleaner technologies has created a dynamic, growing investment market. For the first time, substantial investment is following the rhetoric. Global investment in the energy transition has surged to $1.8 trillion in 2023 and now far exceeds investments made in fossil fuels. Energy transition investments will need to average $4.8 trillion from 2024 to 2030 to reach global net-zero targets by 2050. In the 2030s, it is estimated that average annual investment levels will approach $7 trillion.6
Figure 2. Surging Global Investment in Clean Energy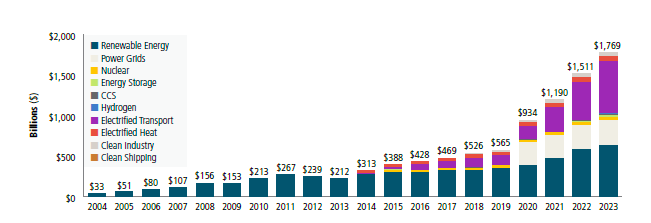
Source: BloombergNEF Energy Transition Trends 2024. Included for illustrative purposes only.
Copper Demand Is on the Rise
By 2050, it’s projected that the global electric grid will need to double in capacity to meet the 86% increase in electricity demand (see Figure 3). Countries must shift their production mix to include a much higher share of greener energy sources to lower greenhouse gas (GHG) emissions from electricity production while accommodating expanding demand. This expansion is estimated to require an annual investment of $1 trillion, accumulating to nearly $21 trillion by 2050. These upgrades necessitate a substantial amount of copper, estimated at 427 million metric tons by 2050.7 Moreover, as urban areas grow, the shift toward underground wiring, which requires twice as much metal as overhead lines, is intensifying the demand for copper.
The shift from internal combustion engines (ICEs) to electric vehicles (EVs) is copper-intensive and critical to decarbonizing transportation. Copper is essential in EVs, finding use in electric motors, batteries, inverters, wiring and charging stations. An EV requires 53 kilograms of copper in electric motors, batteries, inverters, wiring and charging stations, about 2.4 times more than a conventional combustion vehicle uses. This volume of wire can extend up to a mile in length. Although efforts are underway to reduce copper in EVs, demand is still projected to hit 2.8 million metric tons by 2030.8
Additionally, the IEA reports that renewable energy infrastructure, including solar and wind power, needs 2.5 to 7 times more copper than fossil fuel-based technologies, depending on whether the wind installations are onshore or offshore. Solar and wind energy capacity has been on an upward trajectory globally and is expected to continue growing. Supporting this, the U.S. Energy Information Administration (EIA) predicts that solar power might constitute over half of the new U.S. electricity capacity by 2024.
Figure 3. EVs and Renewables Require More Copper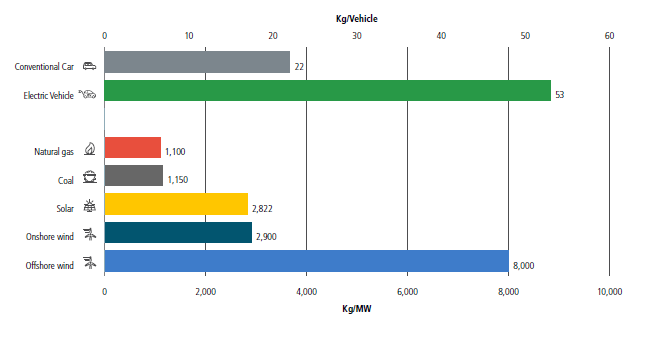
Source: The role of critical minerals in energy transition, IEA, May 2021. Included for illustrative purposes only.
Copper Supply Faces Challenges
While copper is abundant, mining it economically and efficiently is a challenge. Chile and Peru, the top copper-producing countries, are grappling with labor strikes and protests, compounded by declining ore grades. Russia, ranked seventh in copper production, faces an expected decline due to the ongoing war in Ukraine. Despite efforts by miners to ramp up production, many analysts anticipate a widening supply imbalance.
Figure 4. Copper Supply and Demand Imbalance May Likely Grow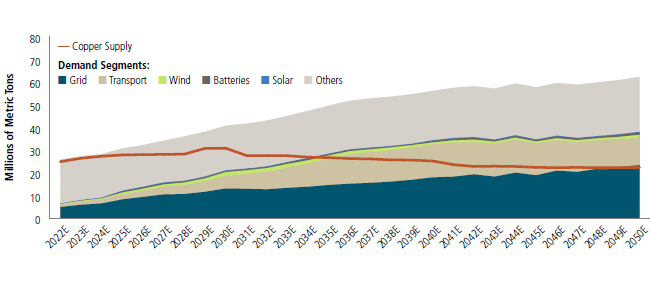
Source: BloombergNEF Transition Metals Outlook 2023. The line represents demand and the shaded area represents supply. Demand is based on a net-zero scenario, i.e., global net-zero emissions by 2050 to meet the goals of the Paris Agreement. Included for illustrative purposes only.
The copper mining industry is both large and mature, having begun thousands of years ago. However, high-quality copper projects are increasingly rare, and major new discoveries are dwindling. The process from discovery to production is lengthy, averaging 16.5 years.9
The process of permitting new mines and expanding existing ones is complex and time-consuming. Addressing the copper supply challenge will require regulatory policy considerations, technological innovations in copper extraction and refining, and a careful evaluation of other minerals upon which copper development depends.
Copper Price Dynamics Spurring New Production
Despite the prediction of a long-term supply deficit, it is projected that in 2024, global mined copper production will grow by 4.1%, reaching 23.5 million metric tons.10 This increase is significantly driven by contributions from Chile, the Democratic Republic of Congo (DRC) and Russia.10
In response to this increased demand, copper miners are primarily focusing their investments on extending the life span and productivity of existing, high-grade and profitable mines. This approach is favored over the exploration and development of new mining projects.
Figure 5. Copper Spot Price Reached New Highs in 2022
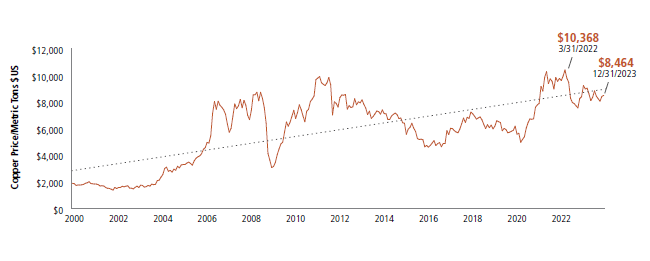
Source: Bloomberg. Data as of 12/31/2023. Past performance is no guarantee of future results. Included for illustrative purposes only.
Capital for the exploration and development of copper mines peaked at $26.13 billion in 2013. Since then, it has almost halved and remained low, with only $14.42 billion spent in 2022. Despite a slight 0.1% decrease in development capital expenditure for copper projects in 2022, a more significant drop of 18.7% is projected for 2023.11
Copper Miners May Offer Opportunities
The anticipated supply-demand dynamic may suggest a strong performance for copper in a bull market. The previous commodity supercycle, driven by China’s industrialization and urbanization, is giving way to a new cycle focused on the global energy transition.
Figure 6. Copper Equities Have Outperformed Spot During Bull Markets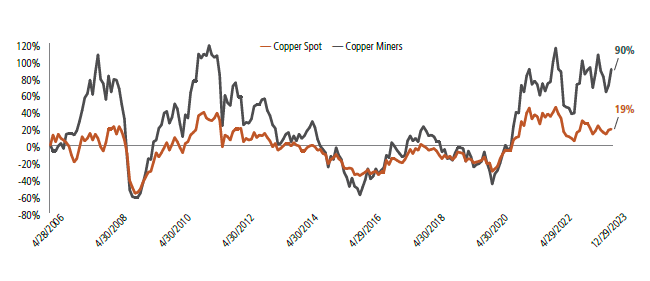
Source: Bloomberg. Data as of 12/31/2023. The copper spot price is measured by the LME Copper Cash ($), Bloomberg ticker LMCADY. Copper Miners is measured by the Solactive Global Copper Miners Index, Bloomberg ticker SOLGLOCO Index. You cannot invest directly in an index. Past performance is no guarantee of future results. Included for illustrative purposes only.
Copper prices and miners are likely to benefit from the growing supply-demand gap. Some miners in particular are thriving due to the optimistic long-term outlook for copper demand. Copper’s strategic importance has driven significant M&A (merger and acquisition) activity in 2022-2023, with major mining companies like BHP and Rio Tinto acquiring copper miners at substantial premiums. Automakers, concerned about securing future supplies of critical minerals like copper, are also investing directly in mining companies.
Investments in copper miners may likely rise, given the supply-demand dynamics and the potential for copper equities to outperform the underlying spot price. The anticipated increase in copper price is necessary to incentivize new production to meet rising demand.
Investing in the Next Era of Copper
Copper’s role as a critical mineral in the U.S. has led to its inclusion in over $30 billion of funding from the Inflation Reduction Act. This support is already materializing, exemplified by the U.S. Department of Energy’s $2 billion loan to Redwood Materials for battery recycling and anode copper foil production.
M&A activity in the copper sector has recently overtaken that in gold, with several companies receiving premiums of over 20%. This reflects the strength and positive outlook of the copper mining industry. As a long-valued asset, copper is entering a new era with the global energy transition. The demand for copper in energy grids, electric vehicles and clean energy technologies, combined with diminishing ore grades and limited inventories, underscores its growing importance and potential for price support. Copper miners may likely be positioned to benefit from these developments.
Additional Copper Resources
Footnotes
| 1 | Copperalliance.org. |
| 2 | BNEF U.S. Power Grid Buildout Dampened by Piecemeal Strategy. August 2023. |
| 3 | Visualcapitalist.com, How Big Is the Oil Market, 6/30/2023. |
| 4 | BloombergNEF, a leading provider of forward-thinking primary research and analysis on the trends driving the transition to a lower-carbon economy. |
| 5 | Metal Center News, 8/4/2023. Copper is included on the Department of Energy Critical Minerals List. |
| 6 | BloombergNEF is a leading provider of forward-thinking primary research and analysis on the trends driving the transition to a lower-carbon economy. |
| 7 | BloombergNEF, A Power Grid Long Enough to Reach the Sun Is Key to the Climate Fight, 3/8/2023. |
| 8 | Reuters, Innovation in EVs seen denting copper demand growth potential, 7/9/2023. |
| 9 | IEA, The Role of Critical Minerals in Clean Energy Transitions, May 2021. |
| 10 | S&P Global. 12/13/2023. |
| 11 | S&P Global Market Intelligence. |
Important Disclosures
An investor should consider the investment objectives, risks, charges and expenses of each fund carefully before investing. To obtain a fund’s Prospectus, which contains this and other information, contact your financial professional, call 1.888.622.1813 or visit SprottETFs.com. Read the Prospectus carefully before investing.
Exchange Traded Funds (ETFs) are considered to have continuous liquidity because they allow for an individual to trade throughout the day, which may indicate higher transaction costs and result in higher taxes when fund shares are held in a taxable account.
The funds are non-diversified and can invest a greater portion of assets in securities of individual issuers, particularly those in the natural resources and/or precious metals industry, which may experience greater price volatility. Relative to other sectors, natural resources and precious metals investments have higher headline risk and are more sensitive to changes in economic data, political or regulatory events, and underlying commodity price fluctuations. Risks related to extraction, storage and liquidity should also be considered.
Shares are not individually redeemable. Investors buy and sell shares of the funds on a secondary market. Only “authorized participants” may trade directly with the fund, typically in blocks of 10,000 shares.
The Sprott Active Metals & Miners ETF, Sprott Active Gold & Silver Miners ETF and the Sprott Silver Miners & Physical Silver ETF are new and have limited operating history.
Sprott Asset Management USA, Inc. is the Investment Adviser to the Sprott ETFs. ALPS Distributors, Inc. is the Distributor for the Sprott ETFs and is a registered broker-dealer and FINRA Member. ALPS Distributors, Inc. is not affiliated with Sprott Asset Management USA, Inc.

