- View the monthly commentary on Copper, Lithium and Nickel.
- View Critical Materials October 31, 2024 Performance Table
- For the latest standardized performance and holdings of the Sprott Critical Materials ETFs, please visit the individual website pages: SETM, LITP, URNM, URNJ, COPP, COPJ and NIKL. Past performance is no guarantee of future results.
Key Takeaways
- Batteries are driving the energy transition, with advancements in lithium iron phosphate technology and increased investments enabling widespread energy storage and electrification adoption.
- Recent strategic moves by governments and corporations underscore the growing importance of batteries in securing a sustainable and resilient energy future.
- Critical minerals like copper, lithium and nickel face near-term pressures, but their indispensable role in renewable energy and electrification supports robust long-term demand.
October in Review
The Nasdaq Sprott Critical Materials™ Index (NSETM™) was flat (-0.04%) in October, closing at 993.23. After an 11.83% surge in September, the NSETM™ Index consolidated its gains in October. Uranium miners surged on news of tech giants investing in nuclear energy to power their AI data centers. Key developments included the restart of the Three Mile Island reactor and advancements in plans for small modular reactors (SMRs). Lithium miners posted gains for the second consecutive month on bullish M&A news and signs of stabilization in lithium carbonate prices despite a lingering supply overhang. In contrast, copper miners retraced some gains in October as copper prices pulled back underwhelming details from China's fiscal stimulus announcement.
Macroeconomic factors played a significant role in October. Stronger-than-expected labor market data early in the month pushed yields higher as expectations for aggressive Federal Reserve interest rate cuts were tempered. Rising yield spreads supported a stronger U.S. dollar, while broad equity markets made all-time highs during mid-October before factoring in emerging U.S. election-related risks. Concerns about higher government spending—whether under a Harris or Trump administration—contributed to rising yields, driven by increasing term premiums as investors demanded compensation for heightened fiscal and debt risks. While growth expectations are being revised higher, there are growing concerns about fiscal dominance and the sustainability of rapidly rising debt and deficits.
Figure 1. Nasdaq Sprott Critical Materials™ Index (2020-2024)
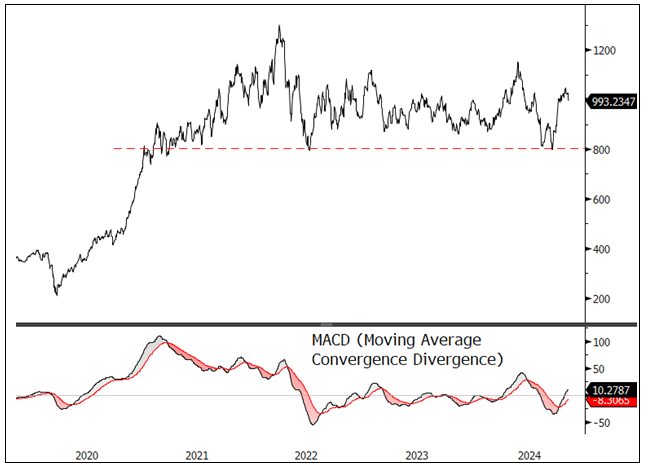
Source: Bloomberg. Nasdaq Sprott Critical Materials™ Index. Data as of 10/31/2024. Moving average convergence/divergence is a trend-following momentum indicator that shows the relationship between two exponential moving averages (EMAs), calculated by subtracting the 26-period EMA from the 12-period EMA. Past performance is no guarantee of future results.
Energy Storage: A Critical Driver of the Energy Transition
The energy storage sector is experiencing explosive growth as the global energy transition gains momentum. Batteries are emerging as a cornerstone of the renewable energy landscape, much like the role solar played a decade ago. This surge in demand is driven by the need for greater energy resilience, integration of renewables and electrification of transportation and heavy industries. Below, we discuss our outlook for the sector.
Market Expansion
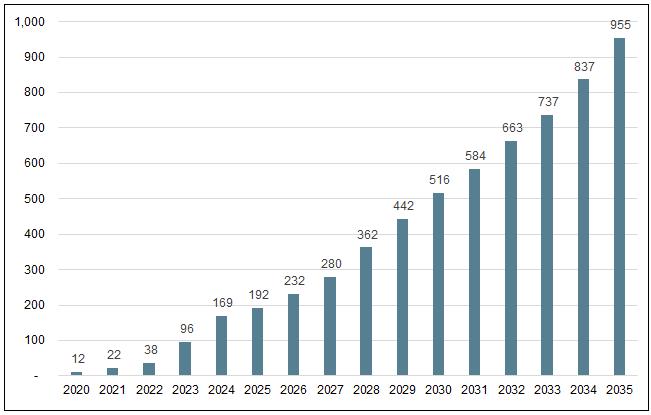
The global energy storage market is poised for a record-breaking year, with installations projected to reach 169 GWh in 2024—a 76% increase from 2023 (see Figure 2). Looking ahead, energy storage is projected to grow at a compound annual growth rate (CAGR) of 17% through 2035, with annual additions potentially reaching 955 GWh. In comparison, global wind and solar markets are forecast to grow at slower CAGRs of 7% and 7.5%, respectively. The U.S., the world's second-largest market after China, is set to add 41 GWh of energy storage capacity in 2024—an 89% increase from 2023—and could reach 112 GWh in annual additions by 2035. Federal policies, such as the Inflation Reduction Act, drive this growth, although success hinges on infrastructure expansion and the streamlining of permitting processes.
Figure 2. Global Energy Storage Installations (2020-2035E)
Source: BNEF.
Key Growth Drivers
- Electrification of the Economy:
Battery storage is vital to electrifying transportation, industry and infrastructure. It is especially critical for transport fleets, including last-mile delivery vehicles, buses, and trucks, as it offers attractive economics and operational efficiency. - Cost-Effectiveness:
Declining battery costs are pivotal in supporting widespread energy storage adoption. Lithium iron phosphate (LFP) batteries, which are nickel-free and highly cost-efficient, have spurred price reductions and are becoming increasingly popular. Additionally, turnkey energy storage systems have become significantly more affordable, with Chinese system costs dropping 43% year-over-year. - Renewable Integration:
Energy storage is indispensable for managing the variability of renewable energy sources. Many recent installations focus on energy-shifting applications, such as price arbitrage and grid balancing, which address the intermittent nature of renewable sources. In regions with high renewable penetration, energy storage supports a stable and reliable power supply.
Battery Storage Applications
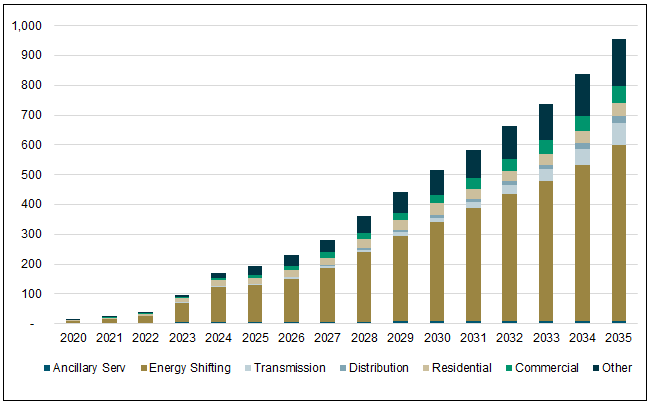
Energy shifting has emerged as the leading application for energy storage systems and is projected to account for 75% of all deployments (in gigawatt-hours) by the end of 2024 (see Figure 3). This dominance is due to the critical need to balance renewable energy sources. Utilities increasingly rely on energy shifting to store surplus power generated by renewables, such as solar and wind, and release it during peak demand periods.
This trend is propelled by government mandates requiring energy storage to be paired with new renewable installations. Such policies support grid stability and energy reliability, particularly as renewable energy penetration continues to rise.
Figure 3. Energy Storage Application by Market (2020-2035E)
Source: BNEF.
Energy-shifting applications typically rely on long-duration storage solutions capable of storing and releasing power for several hours. This trend is primarily supported by lithium-ion batteries, especially those using cost-effective and high-cycle-life lithium iron phosphate (LFP) chemistry, which is particularly suited to energy-shifting needs. Advances in battery technology—such as improved cycle life and declining costs—make energy shifting an increasingly practical solution for large-scale deployment. These innovations have significant implications for grid operators, who now see energy shifting as a feasible alternative to traditional grid investments, such as transmission line expansions, for addressing supply-demand imbalances and managing grid congestion.
By 2035, energy shifting is projected to remain the primary driver of energy storage demand. Beyond integrating renewable energy, it will play a critical role in price arbitrage and capacity services. As the technology matures, its scope may expand to provide broader capacity services, positioning energy storage as a fundamental component of global clean energy strategies.
While energy shifting dominates, ancillary services—essential for maintaining grid reliability, stability and efficiency—account for a smaller portion of energy storage applications, making up just 3% of deployments in 2024. This share is expected to decline further to 1% by 2035, reflecting its niche role within the broader storage market. Residential energy storage, which comprises 11% of deployments in 2024, is also expected to see a reduction in market share by 2035. The commercial segment, currently 4% of total deployments, is projected to grow modestly to 7% by 2035, where weak grid infrastructure supports demand.
Energy storage applications within transmission and distribution are expected to remain minimal until 2030. However, as battery prices continue to fall, this sector is expected to expand, potentially allowing energy storage to be a cost-effective alternative to traditional grid infrastructure investments.
The Rise of LFP Batteries in Stationary Energy Storage
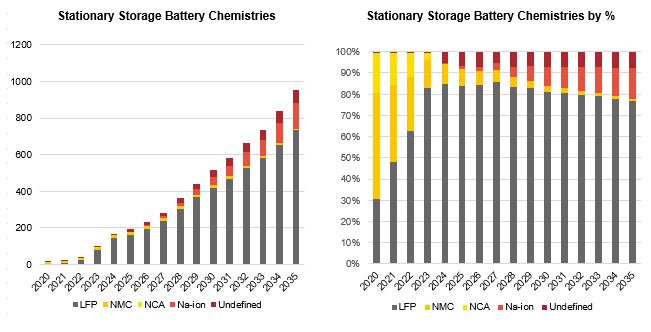
LFP batteries have emerged as the preferred choice for stationary energy storage, commanding an 85% market share in 2024 (see Figure 4). LFP batteries offer distinct advantages that make them well-suited for the energy storage market, including lower costs, enhanced safety and extended cycle life.
Unlike nickel-based lithium-ion batteries, such as nickel manganese cobalt (NMC) or nickel cobalt aluminum (NCA) chemistries, LFP batteries do not rely heavily on higher-cost metals, cobalt and nickel. This makes LFP batteries a more sustainable and economically viable option for large-scale storage deployments.
Figure 4. LFP Dominates the Battery Market
Source: BNEF.
The growth in LFP adoption is driven by the rapid expansion of manufacturing capacity, especially in China, where leading battery producers have significantly increased LFP production. These manufacturers not only meet domestic demand but also are exporting LFP systems worldwide, helping establish LFP as the global standard for energy storage applications. Additionally, many companies outside China produce LFP-based systems, signaling a broad acceptance of this technology for stationary storage solutions.
While LFP batteries generally have lower energy density compared to nickel-based chemistries, this limitation is less significant for stationary applications, where weight and volume are not primary concerns. With high thermal stability and low degradation rates, LFP batteries are ideal for energy-shifting applications requiring frequent cycling, offering reliable daily charge and discharge without substantial capacity loss. Advances in cell and system design have further optimized LFP for large-scale projects, enabling it to effectively meet energy density needs.
While next-generation battery chemistries, such as solid-state and sodium-ion batteries, promise benefits like increased energy density, longer lifespan and reduced fire risk, LFP is expected to maintain its market dominance through 2035. Technological improvements continue to drive down costs and enhance battery life.
While nickel-based batteries, such as NMC, have an advantage in energy density, they are gradually being phased out in the energy storage market due to higher costs and faster degradation. Sodium-ion batteries are emerging as a potential competitor, with volume manufacturing for stationary storage set to begin in 2025. Sodium-ion aims to capture market share in select applications, especially as lithium prices rise and new sodium-ion deployments increase in China. However, LFPs established supply chain, proven performance and economic advantages position it as the likely leader in the stationary storage sector for the foreseeable future.
Resilient Infrastructure and Technological Advancements
Batteries power the grid and add resilience as backup power during natural disasters and peak demand periods. Distributed storage systems at homes, commercial buildings and industrial sites can create microgrids that improve energy security, especially in remote or vulnerable areas. Furthermore, artificial intelligence (AI) and machine learning (ML) optimize battery use by predicting demand surges and enabling precise energy discharge and recharging control, enhancing efficiency and boosting economic returns on battery investments.
Geographical Focus and Regional Drivers
The energy storage boom is a global phenomenon, with regional markets shaped by distinct drivers:
- China remains the world's largest storage market, driven by renewable energy mandates, favorable policies and its extensive manufacturing capacity for cost-effective LFP batteries.
- The U.S. is rapidly scaling up energy storage installations in response to federal and state-level incentives, such as the Inflation Reduction Act, which lowers the economic barriers for renewable and storage developers.
- Europe is experiencing growth in storage deployments, with residential batteries leading. The demand for residential and commercial systems will likely keep pace with the continent's clean energy mandates.
Supply Chain Adaptations and Resource Security
The global battery supply chain is evolving to support this growth. While China continues to dominate battery refining and manufacturing, efforts to localize supply chains in North America and Europe are gaining momentum. This shift is expected to improve supply security and reduce the carbon footprint of transporting batteries. Major battery manufacturers are also adopting LFP technology to stabilize costs and broaden deployment.
Policy and Regulatory Frameworks Supporting Storage Growth
Effective policy and regulatory frameworks are critical for accelerating energy storage adoption. Tax credits, subsidies, renewable portfolio standards and state mandates that require renewable projects to pair with storage foster a favorable market environment. Additionally, modernized grid management and utility regulations that support decentralization are necessary to accommodate the widespread adoption of batteries and renewable energy solutions.
Challenges and Considerations
Despite robust growth, the energy storage sector faces several challenges:
- Overcapacity in the EV Sector: Slowing demand for electric vehicles has prompted battery manufacturers to pivot toward stationary storage markets to absorb excess capacity. This shift encourages innovative battery applications, such as residential storage solutions designed for urban dwellers, which are increasingly popular in Europe.
- Supply Chain Dynamics and Resource Security: Battery supply chains are adapting to mitigate risks associated with critical material supply chains and geopolitical pressures. Developing alternative supply chains outside dominant countries helps stabilize battery costs and reduce dependencies on any single region for critical materials.
- Inflationary Impact and the Green Premium: Many green technologies carry a higher price in the early stages, known as the green premium. If inflationary pressures become too great, this can hinder adoption. A balanced transition strategy (i.e., allowing fossil fuels to temporarily coexist with scaling green technologies) may be necessary to keep the transition affordable and mitigate societal resistance.
The Path Forward for Energy Storage
Led by advancements in battery technology, the energy storage market is poised for sustained growth, driven by technological advancements, cost reductions and supportive policies worldwide. Infrastructure investments targeting high-emission sectors, such as industry, transportation and the grid, are vital to achieving global net-zero targets. With its capacity to decentralize and enhance resilience, battery storage is becoming as fundamental to infrastructure investment as wind and solar power. Batteries are set to be the cornerstone of the next phase in the energy transition, pushing the global economy toward a more sustainable, electrified future.
Updates on Critical Minerals
The Evolving Copper Story: Short-Term Setbacks, Enduring Fundamentals
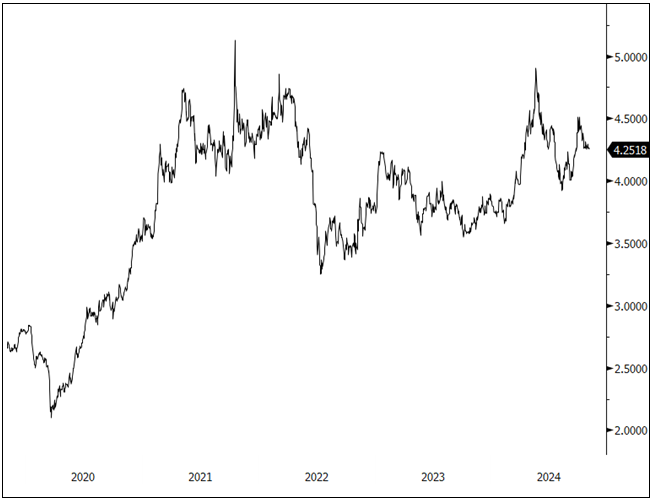
The copper markets pulled back in October, with the spot price falling 3.29% to $4.25. Copper mining stocks fell 8.73%, and copper juniors fell 5.94%. While copper and its miners were laggards in the critical materials complex for the month, they remain standout performers year-to-date, outperforming most other critical materials and mining equities.
In October, copper saw a mix of price fluctuations driven by both macroeconomic factors and evolving market expectations. Early in the month, optimism at the London Metal Exchange (LME) seminar highlighted copper's strong long-term outlook. In an informal poll, 46% of attendees identified copper as the base metal with the greatest price upside—down slightly from 53% last year but still reflecting broad confidence in its future prospects.16
Copper's initial rally in late September was largely fueled by China's announcement of its largest economic stimulus measures since the COVID-19 pandemic. Measures such as lower interest rates eased mortgage regulations, and liquidity injections into the banking system were expected to support copper demand, particularly in construction and infrastructure. However, the rally was short-lived. As markets in China reopened after the national holiday, copper prices retreated amid disappointment over the fiscal stimulus measures, which fell short of expectations. Further, the lack of clarity and concrete policy action weighed on sentiment. At the same time, the strength of the U.S. dollar—driven by stronger-than-expected U.S. jobs data—also added downward pressure. Furthermore, disappointing global economic data, including weaker-than-expected Chinese economic figures, further suppressed sentiment toward copper.
Despite October's challenges, copper's medium- to long-term outlook remains robust. The energy transition, electrification and AI industries continue to drive demand for copper, while mining supply struggles to keep pace. This persistent supply-demand imbalance underpins bullish expectations for copper prices. Geopolitical risks, such as potential tariffs and supply disruptions (e.g., the recent fire at a Freeport project in Indonesia), add another layer of uncertainty. That said, copper remains well-positioned to lead the next commodity supercycle, driven by its critical and ubiquitous role in an increasingly electrified global economy.
Figure 5. Copper Spot Price USD $/lb (2019-2024)
Source: Bloomberg. Data as of 10/31/2024. Past performance is no guarantee of future results.
Corporate Investments Spotlight Lithium's Strategic Value
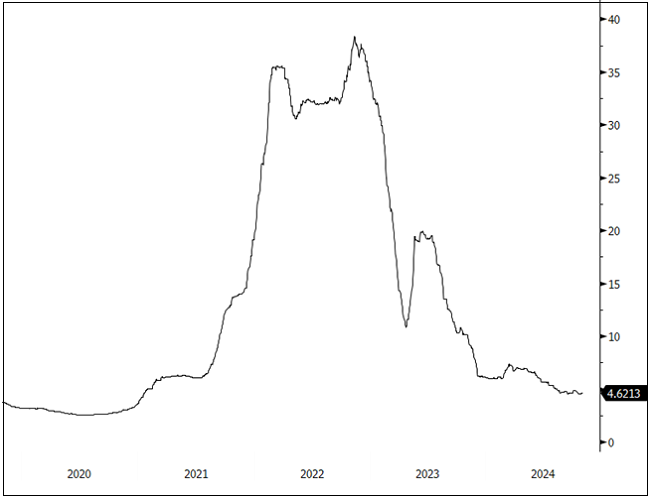
The lithium carbonate spot price fell 5.42% in October. Despite the price drop, lithium miners performed well in October—gaining 3.93%—as large, established and profitable companies outside of the lithium mining industry continue to make substantial investments in lithium miners. These investments are reinforcing the long-term positive sentiment around the lithium industry.
A major development in the lithium sector came from Rio Tinto, which announced a bold counter-cyclical acquisition of Arcadium Lithium for $6.7 billion, representing a 90% premium.17 This acquisition positions Rio Tinto as the third-largest lithium producer in the world and represents the largest-ever deal in the lithium industry. Such a move by a blue-chip mining company is seen as a strong vote of confidence for the future of lithium, signaling that the long-term growth prospects for the metal remain intact despite short-term price fluctuations.
However, the lithium market continues to face challenges, including oversupply from China and a slowdown in EV sales, both of which have placed downward pressure on prices. As a result, corporate valuations in the sector have fallen, making lithium miners increasingly attractive as acquisition targets. Depressed prices could stimulate further interest from prospective buyers looking to secure strategic assets at a lower cost.
This interest in lithium isn't limited to mining companies. ExxonMobil announced last year that it aims to become a leading supplier of lithium by 2030. Similarly, General Motors (GM) made significant moves to secure lithium supply in October, entering into a joint venture with Lithium Americas Corp. for a 38% stake in the Thacker Pass lithium project in Nevada.18 GM’s $625 million investment follows an earlier commitment of $650 million in 2023 to support developing what could become one of North America's largest lithium mines. This partnership reflects the increasing involvement of automakers in lithium mining and refining as they work to secure the raw materials needed for the EV batteries that will power their future vehicles.
In addition to these corporate investments, the U.S. government is also actively supporting domestic lithium production. In October 2024, Lithium Americas Corp. secured a $2.26 billion loan from the U.S. Department of Energy to finance the construction of processing facilities at Thacker Pass in Nevada. This loan is part of broader efforts to ensure the U.S. has a reliable and secure domestic supply of critical minerals for the EV and energy storage industries.
Looking ahead, lithium prices may benefit from seasonal strength as EV sales are expected to rise before the expiration of government subsidies at year-end. This potential short-term boost in demand could stabilize lithium prices as the market navigates its current challenges.
Figure 6. Lithium Carbonate Spot Price USD $ / lb (2019-2024)
Source: Bloomberg. Data as of 10/31/2024. Past performance is no guarantee of future results.
Nickel Market Struggles as Prices Hit Year-to-Date Lows
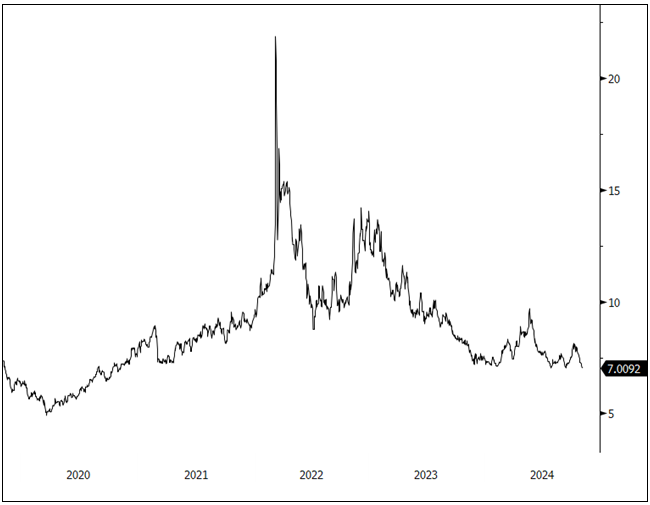
The nickel spot price dropped 9.31% in October, reaching a year-to-date low, while nickel miner stocks fell by 10.50%. This decline was largely driven by broader market pressures, including a lack of significant stimulus measures from China, which also weighed on copper and other base metals.
Indonesia, the world's largest nickel producer, played a pivotal role in October's developments. The country's mining minister reiterated Indonesia's commitment to actively managing nickel ore supply to support prices.19 The Indonesian government has indicated that it intends to continue regulating nickel ore sales and production licenses to balance supply and demand and prevent excessive downward pressure on prices. Over the past year, the government has expressed interest in maintaining nickel prices between $15,000 and $18,000 per metric ton, and current prices are at the lower end of this range. These measures are part of the country's broader strategy to stabilize the nickel market, which would benefit both the government and the miners operating in the region.
However, these efforts were overshadowed by a persistent supply glut in the nickel market, which exerted significant downward pressure on prices. Additionally, Russia's recent threat to limit nickel exports was widely interpreted as a hollow warning, further dampening sentiment and contributing to October's weak performance.
Figure 7. Nickel Spot Price USD $ / lb (2019-2024)
Source: Bloomberg. Data as of 10/31/2024. Past performance is no guarantee of future results.
Performance as of October 31, 2024 Performance
| Metric | 10/31/2024 | 9/30/2024 | Change | % Chg | YTD Chg | Monthly Comment |
| Miners | ||||||
| Nasdaq Sprott Critical Materials™ Index1 | 993.23 | 993.67 | (0.43) | (0.04)% | 0.74% |
NSETMTM Index consolidated the September gains. While copper miners pared some gains, uranium and lithium miners continued to advance. Positive news from Big Tech plans for nuclear power use for datacenters reinforced the positive long-term uranium fundamentals. Lithium carbonate continues to show signs of basing. |
| Nasdaq Sprott Lithium Miners™ Index2 | 489.46 | 470.97 | 18.49 | 3.93% | (33.54)% | |
| North Shore Global Uranium Mining Index3 | 3,806.36 | 3,716.04 | 90.32 | 2.43% | (1.04)% | |
| Nasdaq Sprott Copper Miners Index4 | 1,250.18 | 1,369.71 | (119.53) | (8.73)% | 19.49% | |
| Nasdaq Sprott Nickel Miners™ Index5 | 581.65 | 641.36 | (59.71) | (9.31)% | (12.01)% | |
| Nasdaq Sprott Junior Copper Miners™ Index6 | 1,152.68 | 1,225.41 | (72.74) | (5.94)% | 19.15% | |
| Nasdaq Sprott Junior Uranium Miners™ Index7 | 1,463.31 | 1,421.57 | 41.75 | 2.94% | 0.59% | |
| Physical Materials | ||||||
| Lithium Carbonate Spot Price $/lb8 | 4.62 | 4.88 | (0.26) | (5.42)% | (25.05)% |
Nearing cycle low. |
| U3O8 Uranium Spot Price $/lb9 | 79.96 | 81.95 | (1.99) | (2.42)% | (12.22)% |
Consolidating gains from Big Tech and AI announcements. |
| LME Copper Spot Price $/lb10 | 4.25 | 4.40 | (0.14) | (3.29)% | 10.75% |
Falls on weak Chinese fiscal stimulus. |
| LME Nickel Spot Price $/lb11 | 7.01 | 7.83 | (0.82) | (10.50)% | (5.63)% |
Hits YTD low. |
| Benchmarks | ||||||
| S&P 500 Index12 | 5,705.45 | 5,762.48 | (57.03) | (0.99)% | 19.62% |
The S&P 500 backed off from all-time highs as bond yields backed higher, bringing the USD higher along with it. Yields have risen on concerns of fiscal spending concerns, higher GDP growth, stickier inflation, and a shallower Fed rate cut path. |
| DXY US Dollar Index13 | 103.98 | 100.78 | 3.20 | 3.17% | 2.61% | |
| BBG Commodity Index14 | 98.10 | 100.34 | (2.24) | (2.24)% | (0.56)% | |
| S&P Metals & Mining Index15 | 3,254.93 | 3,247.02 | (7.54) | (0.23)% | 6.24% | |
*Mo % Chg and YTD % Chg for this Index are calculated as the difference between the month end's yield and the previous period end's yield, instead of the percentage change. BPS stands for basis points.
- For the latest standardized performance and holdings of the Sprott Critical Materials ETFs, please visit the individual website pages: SETM, LITP, URNM, URNJ, COPP, COPJ and NIKL. Past performance is no guarantee of future results.
Footnotes
| 1 | The Nasdaq Sprott Energy Transition Materials™ Index (NSETM™) is designed to track the performance of a selection of global securities in the energy transition materials industry, and was co-developed by Nasdaq® and Sprott Asset Management LP. |
| 2 | The Nasdaq Sprott Lithium Miners™ Index (NSLITP™) is designed to track the performance of a selection of global securities in the lithium industry, including lithium producers, developers and explorers; the Index was co-developed by Nasdaq® and Sprott Asset Management LP. |
| 3 | The North Shore Global Uranium Mining Index (URNMX) is designed to track the performance of companies that devote at least 50% of their assets to the uranium mining industry, which may include mining, exploration, development and production of uranium, or holding physical uranium, owning uranium royalties or engaging in other non-mining activities that support the uranium mining industry. |
| 4 | The Nasdaq Sprott Copper Miners™ Index (NSCOPP™) is designed to track the performance of a selection of global securities in the copper industry. |
| 5 | Nasdaq Sprott Nickel Miners™ Index (NSNIKL™) is designed to track the performance of a selection of global securities in the nickel industry. |
| 6 | Nasdaq Sprott Junior Copper Miners™ Index (NSCOPJ™) is designed to track the performance of mid-, small- and micro-cap companies in copper-mining related businesses. |
| 7 | Nasdaq Sprott Junior Uranium Miners™ Index (NSURNJ™) is designed to track the performance of mid-, small- and micro-cap companies in uranium-mining related businesses. |
| 8 | The lithium carbonate spot price is measured by the China Lithium Carbonate 99.5% DEL. Source Bloomberg and Asian Metal Inc. Ticker L4CNMJGO AMTL Index. Data converted to pounds and to USD with Bloomberg FX Rates. |
| 9 | The U3O8 uranium spot price is measured by a proprietary composite of U3O8 spot prices from UxC, S&P Platts and Numerco. |
| 10 | The copper spot price is measured by the LME Copper Cash ($). Source Bloomberg ticker LMCADY. Data converted to pounds. |
| 11 | The nickel spot price is measured by the LME Nickel Cash ($). Source Bloomberg ticker LMNIDY. Data converted to pounds. |
| 12 | The S&P 500 or Standard & Poor's 500 Index is a market-capitalization-weighted index of the 500 largest U.S. publicly traded companies. |
| 13 | The U.S. Dollar Index (USDX, DXY) is an index of the value of the U.S. dollar relative to a basket of foreign currencies. |
| 14 | The Bloomberg Commodity Index (BCOM) is a broadly diversified commodity price index that tracks prices of futures contracts on physical commodities, and is designed to minimize concentration in any one commodity or sector. It currently has 23 commodity futures in six sectors. |
| 15 | The S&P Metals & Mining Select Industry Index comprises stocks in the S&P Total Market Index that are classified in the GICS metals & mining sub-industry. |
| 16 | Source: Mining.com, Copper takes top spot again as best prospect at LME seminar. |
| 17 | Source: Reuters, Rio Tinto goes all in on lithium with $6.7 billion Arcadium buy. |
| 18 | Source: CIMMagazine, GM investing US$625 million in joint venture with Lithium Americas. |
| 19 | Source: Reuters, Indonesia aims to manage nickel ore supply to support prices. |
Investment Risks and Important Disclosure
Relative to other sectors, precious metals and natural resources investments have higher headline risk and are more sensitive to changes in economic data, political or regulatory events, and underlying commodity price fluctuations. Risks related to extraction, storage and liquidity should also be considered.
Gold and precious metals are referred to with terms of art like "store of value," "safe haven" and "safe asset." These terms should not be construed to guarantee any form of investment safety. While “safe” assets like gold, Treasuries, money market funds and cash generally do not carry a high risk of loss relative to other asset classes, any asset may lose value, which may involve the complete loss of invested principal.
Past performance is no guarantee of future results. You cannot invest directly in an index. Investments, commentary and opinions are unique and may not be reflective of any other Sprott entity or affiliate. Forward-looking language should not be construed as predictive. While third-party sources are believed to be reliable, Sprott makes no guarantee as to their accuracy or timeliness. This information does not constitute an offer or solicitation and may not be relied upon or considered to be the rendering of tax, legal, accounting or professional advice.


